Indian Economy
Gist of Economic Survey 2023-24
- 30 Jul 2024
- 234 min read
01: State Of The Economy: Steady As She Goes
What is the Current State of the Indian Economy?
- Economic Growth and Trends:
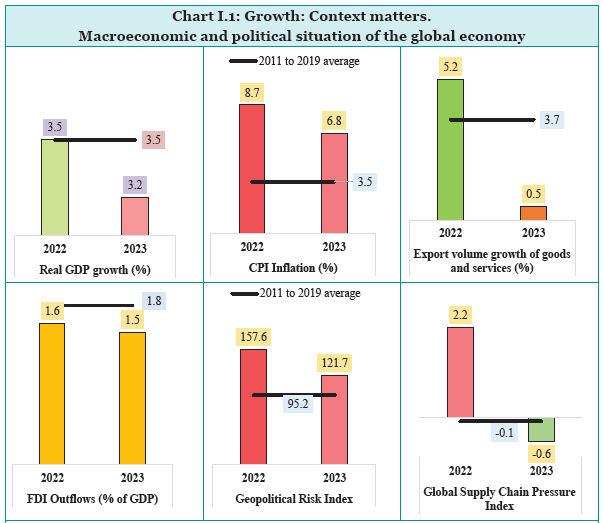
- Global Growth Rate: The global economy grew by 3.2% in 2023, slightly lower than previous years but higher than earlier projections of 2.8%.
- Regional Performance:
- Emerging Markets: Many emerging economies outperformed expectations, buoyed by resilient domestic demand and strategic policy responses.
- Advanced Economies: While the US continued its growth momentum, the Euro area faced subdued economic activity despite signs of recovery.
- Asia: China and India showed significant recovery post-pandemic, with robust growth rates surpassing pre-crisis levels.
- Inflation and Monetary Policy:
- Inflationary Pressures: Persistent core inflation remained a challenge, influenced by strong labour markets and service sector dynamics, particularly in advanced economies.
- Monetary Policy: Central banks globally responded by maintaining or raising interest rates to combat inflation, although China pursued stimulus measures to support its economic recovery.
- Geopolitical Impacts:
- Supply Chain Disruptions: The escalation of conflicts, such as the Russia-Ukraine crisis and geopolitical tensions in the Middle East, intermittently disrupted global supply chains, affecting trade and economic operations.
- Trade and Investment: Despite easing supply chain pressures, global trade growth was modest, with rising cross-border restrictions and cautious investor sentiment leading to a decline in foreign direct investment flows.
- Sectoral Resilience:
- Services sectors, including finance and technology, demonstrated resilience post-pandemic while manufacturing sectors faced challenges due to high input costs and fluctuating demand.
- India's Economic Resilience:
- India's economy continued its upward trajectory in FY24, maintaining momentum despite global challenges.
- GDP Growth: India's real GDP grew by 8.2% in FY24, exceeding the 8% mark in three out of four quarters of FY24.
- Sectoral Growth: The services sector, bolstered by financial and professional services, led growth, while the manufacturing and construction sectors also showed significant expansion.
- Economic Indicators:
- Private Consumption: Private final consumption expenditure remained strong, supported by urban and rural demand growth across various sectors.
- Private final consumption expenditure (PFCE) grew by 4.0% in real terms in FY24.
- Investment Dynamics: Gross Fixed Capital Formation (GFCF) increased, reflecting sustained private and government investment activities.
- Between FY19 and FY23, the cumulative growth in private sector non-financial Gross Fixed Capital Formation (GFCF) is 52% at current prices while for general government (which includes states) is 64%.
- Financial Sector: The banking sector maintained stability, supporting credit growth to key sectors such as MSMEs and housing.
- Private Consumption: Private final consumption expenditure remained strong, supported by urban and rural demand growth across various sectors.
- Trade and External Factors:
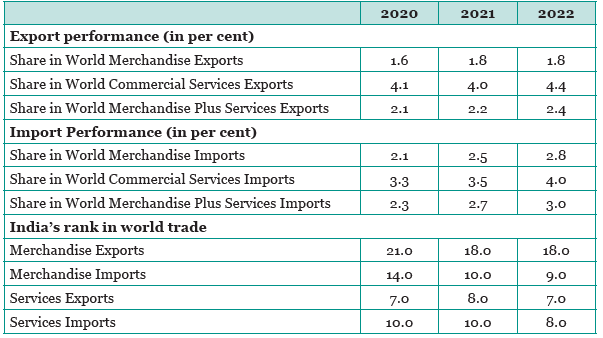
- Export Performance: India's merchandise exports saw growth, supported by resilient services trade despite global trade slowdowns.
- Union Government Finances:
- Fiscal Deficit: Reduced from 6.4% to 5.6% of GDP in FY24, aided by robust tax revenues and restrained expenditure.
- Tax Reforms: Direct tax revenues grew by 15.8% and indirect taxes by 10.6%, reflecting improved tax compliance and structural reforms.
- Capital Expenditure and Economic Stimulus:
- Government Investments: Increased capital expenditure by 28.2% YoY in FY24, focusing on infrastructure development and boosting private sector participation.
- National Monetisation Pipeline (NMP): Raised Rs 3.9 lakh crore from asset monetisation, supporting fiscal objectives and enhancing capital allocation efficiency.
- Domestic Inflation Control:
- Retail inflation decreased from 6.7% in FY23 to 5.4% in FY24 despite global disruptions.
- Government interventions in LPG, petrol, and diesel prices aided inflation management.
- Financial System Resilience:
- RBI’s regulatory measures maintained stability with Gross Non-Performing Assets (GNPA) ratio at a 12-year low of 2.8%.
- Scheduled Commercial Banks’ (SCB) profitability indicators remained robust, ensuring systemic strength.
- Trade and Foreign Inflows:
- Merchandise exports moderated due to global demand, balanced by lower import growth.
- Service exports reached USD 341.1 billion.
- The current Account Deficit (CAD) stood at 0.7% of the GDP during FY24, an improvement from the deficit of 2.0% of GDP in FY23.
- Foreign portfolio investment (FPI) inflows surged to USD 44.1 billion, bolstering forex reserves and stabilising the rupee.
- External Debt and Exchange Rate:
- External debt remained manageable at 18.7% of GDP.
- Forex reserves covered over 11 months of imports, securing against external shocks.
- Inclusive Growth Initiatives:
- Welfare Reforms:
- Shift from input-based to outcome-based welfare under flagship schemes like PM Ujjwala Yojana and PM-AWAS Yojana.
- Direct Benefit Transfer (DBT) and Jan Dhan Yojana enhanced fiscal efficiency and reduced leakages.
- Social Sector Impact:
- The decline in poverty and rise in consumption expenditure showcased tangible benefits.
- Empowerment initiatives like the Aspirational Districts Programme and the Vibrant Villages Programme targeted rural development.
- Welfare Reforms:
- Economic Growth Forecast:
- Projected real GDP growth is 6.5–7% for FY25, supported by structural reforms and improving global economic conditions.
- Risks balanced amidst global uncertainties and monetary policy adjustments.
02: Monetary Management and Financial Intermediation: Stability is the Watchword
What is the Status of India’s Monetary Management and Financial Intermediation?
- Monetary Policy and Inflation Control:
- The Reserve Bank of India (RBI) maintained a steady policy repo rate at 6.5% throughout FY24.
- Inflation remained under control, despite global economic pressures post-Russia-Ukraine conflict.
- Food inflation stood at 6.6% in FY23 and increased to 7.5% in FY24.
- Significant policy repo rate hikes (250 basis points) from from 4% in May 2022 to 6.5 % in February 2023, this influenced lending and deposit rates.
- Liquidity Management:
- RBI's liquidity interventions included Variable Rate Reverse Repo (VRRR) and Variable Repo (VRR) auctions, totaling 49 fine-tuning operations in FY24.
- Temporary measures like Incremental Cash Reserve Ratio (I-CRR) managed surplus liquidity.
- Banking Sector Performance:
- India's banking sector improved with a lower Gross Non-Performing Assets (GNPA) ratio of 2.8% in FY24.
- Agriculture, Micro, Small and Medium Enterprises (MSME), and personal loans showed robust credit growth.
- Initiatives like Kisan Credit Card (KCC) and Emergency Credit Linked Guarantee Scheme (ECLGS) enhanced credit availability.
- Digital Financial Inclusion:
- Digital infrastructure and credit bureaus played pivotal roles in enhancing financial inclusion.
- Introduction of Open Credit Enablement Network (OCEN) is expected to further streamline credit flows.
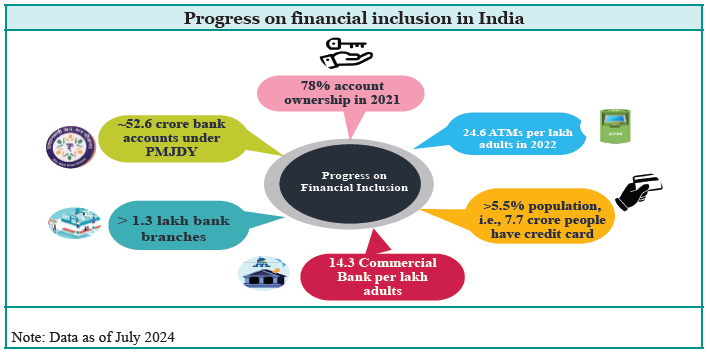
- The number of adults with an account in a formal financial institution increased from 35% in 2011 to 77% in 2021.
- India has more than 116.5 crore smartphone subscribers as of 31st March 2024 enhancing the success of UPI.
- Securities Markets and Financial Services:
- India's stock market capitalization to GDP ratio ranked fifth globally, supported by robust regulatory frameworks and digital infrastructure.
- India’s market capitalisation to GDP ratio has improved significantly over the last five years to 124% in FY24, compared to 77% in FY19, far higher than that of other emerging market economies like China and Brazil.
- Gujarat International Finance Tec-City (GIFT City) emerged as a global financial hub, facilitating international financial services.
- Developments in the Insurance Sector:
- Total global insurance premiums contracted by 1.1% in real terms in 2022.
- Non-life insurance sector saw a 0.5% increase, driven by rate hardening in developed markets.
- Life insurance premiums contracted by 3.1% in 2022.
- Overall insurance penetration (a percentage of total premiums collected to the country's GDP) in India moderated slightly to 4% in FY23, from 4.2% in FY22.
- Insurance penetration in the life-insurance segment declined from 3.2 % in FY22 to 3% in FY23, while it remained flat at 1 % for the non-life insurance segment.
- Overall insurance density (a ratio of total insurance premium collected to total population of the country) increased from USD 91 in FY22 to USD 92 in FY23.
- Ayushman Bharat Pradhan Mantri Jan Arogya Yojana (AB-PMJAY) achieved a milestone by issuing 34.2 crore Ayushman cards across India, with 49.3% of them held by females.
- Government and Regulatory Responses:
- Regulatory Framework: Strengthening of banking regulations, amendments in recovery laws, and enactment of the Insolvency and Bankruptcy Code (IBC) aimed at resolving stress in banks and corporations.
- Asset Reconstruction Companies (ARCs) have emerged as key players in acquiring distressed assets and facilitating their resolution.
- During FY23, 28 ARCs were operating in the market and 9.7% of the previous year’s stock of Scheduled Commercial Banks (SCB)’s GNPAs was sold to ARCs, compared to only 3.2 %in FY22.
- Enhancing Investor Participation:
- SEBI facilitated Foreign Portfolio Investors (FPIs) investment in debt instruments issued by companies undergoing resolution.
- In 2022, SEBI introduced the Special Situation Fund, a sub-component of the Alternative Investment Funds, to allow investors to invest in security receipts (SRs) issued by ARCs.
- These measures have led to an increase in FPI investment in security receipts (SRs) issued by ARCs from around Rs 10,000 crore to Rs 14,482 crore during FY22.
- National Asset Reconstruction Company (NARCL) established to acquire distressed assets from banks with government-backed guarantees, thereby clearing bank balance sheets for further lending.
- Microfinance Institutions (MFI):
- RBI's regulatory framework ensures uniformity and consumer protection across all microfinance entities.
- Self-regulatory organisations (SROs) like Sa-Dhan and MFIN contribute to maintaining ethical practices and standards within the sector.
- About 74% of MFI clients reside in rural areas, emphasising their role in rural development.
- Women constitute 98% of MFI clients, highlighting the sector's emphasis on women empowerment.
- SC/ST borrowers represent 23% of MFI clients, showcasing inclusive growth initiatives.
- MFIs have shown robust performance with Return on Assets (RoA) and Return on Equity (RoE) improving consistently.
- RBI's regulatory framework ensures uniformity and consumer protection across all microfinance entities.
- Developments in the Pension Sector:
- In India, the share of insurance and pension fund assets in GDP stands at 19% and 5%, respectively, compared to a high of 52% and 122% in the USA and 112% and 80% in the UK.
- As of March 2024, India's pension sector had 735.6 lakh subscribers, marking an 18% year-on-year increase from 623.6 lakh in March 2023.
- The total number of Atal Pension Yojana (APY) subscribers, including its earlier version, National Pension Scheme (NPS) Lite, grew from 501.2 lakh in March 2023 to 588.4 lakh in March 2024.
- APY subscribers constitute approximately 80% of the total pension subscriber base.
- Female subscribers in APY have increased from 37.2% in FY17 to 48.5% in FY23.
- Pension coverage under NPS and APY as a percentage of the total population has increased from 1.2% in FY17 to 5.3% in FY24.
- The Financial Sector Assessment Program (FSAP) for India:
- FSAP is a periodic assessment jointly conducted by the IMF and World Bank in countries with significant financial sectors, which aims to comprehensively analyse financial stability and sector development.
- India underwent its first FSAP in 2011-12 and the second in 2017 and India's third FSAP is scheduled for 2023-24, with reports expected to be published by February 2025.
03: Prices and Inflation: Under Control
What are the Prices and Inflation Trends in India?
- India's Recent Inflation Trends
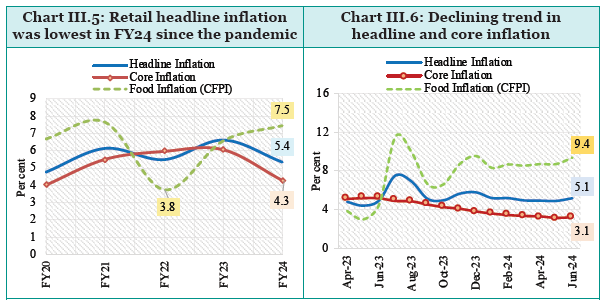
- India successfully managed to maintain retail inflation at 5.4% in FY24, marking the lowest level since the onset of the Covid-19 pandemic.
- As per the recent data released by the Ministry of Statistics and Programme Implementation (MoSPI), the retail inflation rate was 5.1% in June 2024.
- Following the pandemic and subsequent supply chain disruptions due to events like the Russia-Ukraine war, global inflation trends were characterized by a decline, primarily driven by reduced energy prices and coordinated monetary tightening in advanced economies.
- According to International Monetary Fund (IMF) data, India's inflation rate consistently remained lower than the global average and that of Emerging Markets and Developing Economies (EMDEs) in 2022 and 2023.
- Factors Influencing India's Inflation Management:
- Established monetary policies, economic stability, efficient market mechanisms, and stable currency conditions.
- Domestic Retail Inflation Trends
- Gradual decline in core inflation to 3.1% by June 2024.
- Government interventions, including price cuts in LPG, petrol, and diesel, significantly contributed to lowering fuel inflation.
- The Pradhan Mantri Garib Kalyan Anna Yojana ensured food security for vulnerable populations.
- Core Inflation Dynamics
- Due to effective monetary policy transmission and subdued inflationary pressures in both goods and services sectors the core inflation saw a decline to a four-year low in FY24.
- The RBI has increased the repo rate gradually by 250 basis points from May 2022 to February 2023.
- Consequently, core inflation declined by around four percentage points between April 2022 and June 2024.
- Consumer durables inflation moderated due to improved raw material supply, while core services inflation, although stable, remained a focus area for policy adjustments.
- Food Inflation Challenges and Mitigation Strategies
- Adverse weather conditions severely impacted food production, leading to increased prices of essential commodities like vegetables, pulses, and milk.
- Food inflation stood at 6.6% in FY23 and increased to 7.5% in FY24.
- Timely actions such as open market sales, imports, and policy restrictions on exports (e.g., sugar) helped stabilise food prices amidst global volatility.
- Rural areas, with higher reliance on food items in the consumption basket, experienced higher inflation rates compared to urban areas, reflecting interstate variations and differential impacts of price movements.
- Outlook and Future Strategies
- The RBI and IMF project a gradual alignment of India's inflation towards the target range.
- The RBI projects inflation to fall to 4.5% in FY25 and 4.1% in FY26, while IMF has projected an inflation rate of 4.6% in 2024 and 4.2% in 2025 for India.
- Anticipated declines in global commodity prices, particularly in energy and food sectors, are expected to further support India's inflation outlook.
- To sustain long-term price stability, enhancing domestic production of key commodities like edible oils and pulses, improving storage facilities for perishable items, and refining high-frequency price monitoring mechanisms are crucial.
04: External Sector: Stability Amid Plenty
How is India's External Sector Performing Amidst Global Uncertainties?
- Global Foreign Direct Investment (FDI):
- Global FDI declined marginally by 2% to USD 1.3 trillion in 2023 (UNCTAD).
- Global trade in merchandise fell by 5% in 2023 amid these geopolitical challenges.
- External debt as a percentage of GDP in Emerging Market and Developing Economies (EMDEs) increased to 29.8% in 2023 from 26.2% in 2012.
- Trade practices such as ‘decoupling’, ‘derisking’, and ‘reshoring’ are reshaping international trade relationships.
- Global FDI declined marginally by 2% to USD 1.3 trillion in 2023 (UNCTAD).
- India’s International Trade Sector:
- Overall Trade Performance:
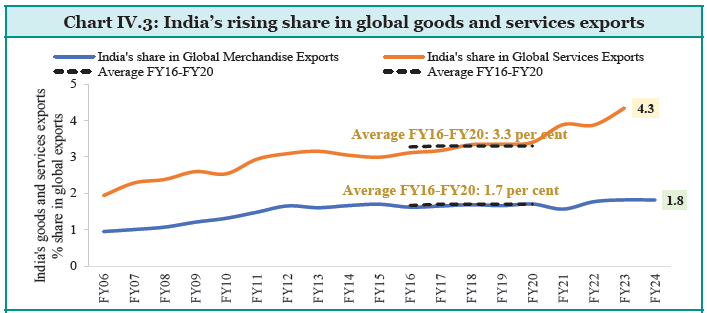
- India’s trade openness indicator rose from 37.5% in FY05 to 45.9% in FY24, significantly contributing to economic growth through efficient resource allocation.
- The share of trade in GDP (excluding petroleum products exports and crude oil imports) rose from 32.3% in FY05 to 40.8% in FY23.
- Merchandise Trade Trends:
- India’s merchandise exports and imports showed resilience amidst global challenges, with exports crossing USD 776 billion and imports at USD 898 billion in FY23.
- In FY24, merchandise exports grew slightly by 0.23%, while imports declined by 4.9%, widening the trade deficit.
- Engineering goods maintained dominance with a 25% of total export share, followed by agriculture and allied products (11%).
- Electronics exports saw significant growth from 0.63 % in 2018 to 0.88% in 2022, ranking 24th globally in 2022, up from 28th in 2018.
- Services Sector:
- India’s services exports grew at a CAGR of over 14% from 1993 to 2022, contributing significantly to India’s export basket.
- India’s services exports grew by 4.9% to USD 341.1 billion in FY24, with growth largely driven by IT/software services and ‘other’ business services.
- IT services remained the largest contributor (48%), followed by other business services (26%).
- India’s External Debt Trends:
- India’s management of external debt has been adept, navigating challenges while maintaining fiscal discipline.
- The external debt to GDP ratio declined to 18.7% at the end of March 2024 from 19.0% at the end of March 2023.
- The share of short-term debt in total external debt declined to 18.5% at the end of March 2024 from 20.6% at the end of March 2023.
- Remittance:
- The net private transfer receipts, mainly representing remittances by Indians employed overseas, was USD 106.6 billion in FY24, against their level of USD 101.8 billion during the previous year.
- The increase in remittances was driven mainly by declining inflation and strong labour markets in the US and Europe, the largest destination for India’s skilled migrants, and other OECD destinations, as well as positive demand for skilled and less-skilled workers in the GCC countries
- Balance of Payments:
- The current account balance has shown resilience, supported by robust services exports, buffering the economy against external shocks.
- Foreign Exchange Reserves (FER) and International Investment Position (IIP):
- India’s FER and IIP remain robust, providing stability amidst global uncertainties.
- Overall Trade Performance:
India’s Rising Participation in Global Value Chains (GVCs)
|
- Changing Landscape of India’s Trade Arrangements
- India’s approach to global trade involves a mix of multilateral engagements and bilateral FTAs, aimed at expanding market access and optimising trade relations.
- India’s recent FTAs with Mauritius, UAE, Australia, and CEPA and India-Australia ECTA, offers specific advantages, including preferential access to key markets and sectors like pharmaceuticals and digital trade.
- Ongoing negotiations with partners like the UK, EU, and ASEAN reflect India’s commitment to broadening its trade footprint globally.
- Economic Impacts and Outlook
- India’s participation in GVCs and proactive trade policies have contributed positively to economic indicators like the Current Account Balance (CAB) and capital inflows.
- Improved Current Account Deficit (CAD) in FY24, bolstered by rising services exports and remittances, underscores India’s stable external sector.
- India’s CAD narrowed to USD 23.2 billion (0.7 per cent of GDP) in FY24 from USD 67 billion (2% of GDP) during the previous year.
- A narrowing merchandise trade deficit and rising service exports have improved the CAD, ending with a surplus of 0.6% of GDP in Q4 of FY24.
- Robust Foreign portfolio investment (FPI) inflows and ongoing FDI interest in key sectors highlight investor confidence and economic stability.
- Over the last two decades, India’s FDI and equity portfolio inflows have totalled about 2.5% of GDP annually (IMF, 2023).
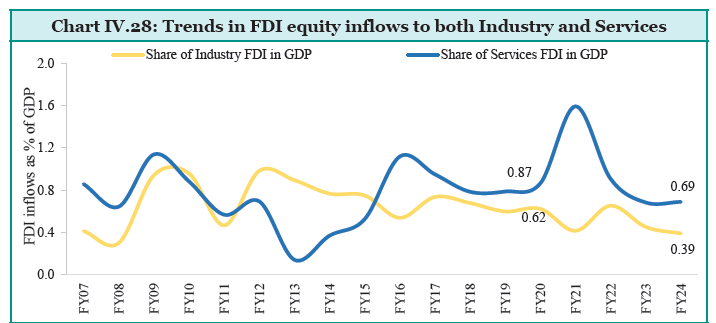
- FDI in the Industry and Services Sector
- Recent years have seen a decline in FDI inflows relative to GDP, particularly in the industry and services sectors.
- Net FDI inflows to India declined from USD 42.0 billion during FY23 to USD 26.5 billion in FY24.
- However, gross FDI inflows moderated by only 0.6% in FY24.
- The share of industry sector FDI in GDP dropped from 0.62% in FY20 to 0.39% in FY24.
- Similarly, the services sector's FDI share decreased from 0.87% to 0.69% over the same period.
- Investment intentions have shifted notably towards new and futuristic sectors such as renewables, artificial intelligence, EVs, and semiconductors. This shift indicates a growing attractiveness of high-tech and sustainable sectors for FDI.
- Physical FDI vs Digital FDI
- Historically dominant, physical FDI (includes sectors such as automobiles, pharmaceuticals, and construction) has faced challenges due to geopolitical factors and the rise of non-equity modes of international production like contract manufacturing.
- Rising protectionism and geopolitical tensions have constrained physical FDI, affecting sectors reliant on traditional manufacturing and infrastructure investments
- While, digital FDI (computer services, telecommunications, consultancy services, and information and broadcasting) witnessed significant growth, driven by sectors like software, hardware, and digital services.
- The share of digital FDI in total FDI rose from 46.6% in FY17 to 69.2% in FY21.
- Enhanced by global trends towards digital transformation, including AI, cybersecurity, and data analytics, India has become a preferred destination for digital investments.
- The pandemic accelerated this trend as digital infrastructure became essential for business continuity.
- Historically dominant, physical FDI (includes sectors such as automobiles, pharmaceuticals, and construction) has faced challenges due to geopolitical factors and the rise of non-equity modes of international production like contract manufacturing.
- Exchange Rates and Economic Stability:
- Despite global economic volatility, the Indian Rupee exhibited relative stability against major currencies in FY24, reflecting strong macroeconomic fundamentals and policy interventions by the RBI.
- India’s foreign exchange reserves reached USD 653.7 billion in June 2024, bolstering economic resilience and ensuring liquidity to meet external obligations.
- India’s foreign exchange reserves is enough to cover more than 10 months of imports projected for FY25 and more than 98% of total external debt outstanding at the end of March 2024.
- Government Initiatives on Trade Facilitation
- India has implemented various measures to bolster trade efficiency, reduce logistics costs, and streamline export processes.
- To boost efficiency and lower logistics costs, the Government launched the PM GatiShakti and the National Logistics Policy.
- Digital reforms, such as the Unified Logistics Interface Platform (ULIP) and the Logistics Data Bank, are additional measures taken towards improving logistics.
- The Government has also streamlined trade processes, enhancing transparency and promoting cooperation among stakeholders through initiatives such as Turant, Customs, Single Window Interface for Facilitation of Trade (SWIFT), pre-arrival data processing, e-Sanchit, and Coordinated Border Management.
- Upgrades in port infrastructure under schemes like Sagarmala have augmented India’s maritime trade capabilities, supporting increased cargo throughput and reduced turnaround times.
- Initiatives, such as railway track electrification, reduced release times by the Land Ports Authority of India (LPAI), and the launch of NLP Marine for port-related logistics were also undertaken.
- Challenges and Outlook:
- Ongoing geopolitical tensions and protectionist policies pose risks to India’s trade and investment environment, influencing FDI inflows.
- To sustain FDI growth, India must enhance ease of doing business, strengthen regulatory frameworks, and invest in critical sectors like digital infrastructure and sustainable technologies.
05: Medium-Term Outlook: A Growth Vision for New India
What is India’s Medium-Term Growth Outlook?
- India’s economy has demonstrated resilience over the past decade setting it on a path to become the world's third-largest economy.
- With sustained efforts, India can maintain a 7% growth rate in the medium term.
- Despite global challenges such as geopolitical conflicts, economic nationalism, and climate change, India aims to balance growth with sustainability and security, primarily relying on domestic resources for investment and development.
Key Areas of Policy Focus for Short to Medium-Term Growth:
- Generating Productive Employment
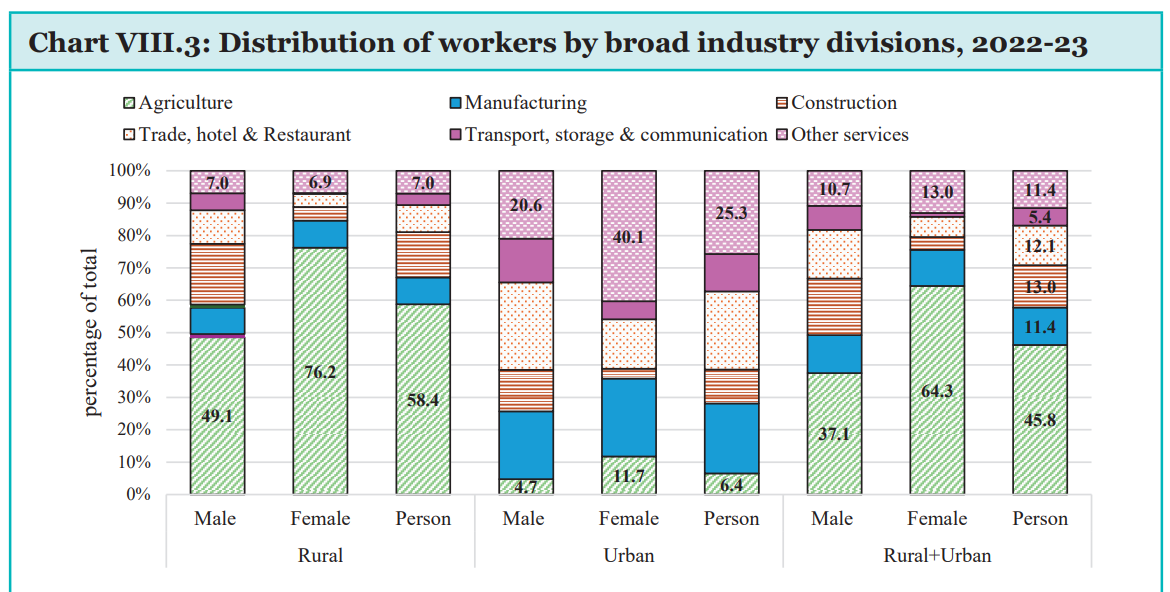
- Current Workforce Distribution:
- Agriculture: 45%
- Manufacturing: 11.4%
- Services: 28.9%
- Construction: 13%
- Job Creation Needs: India needs to generate 78.51 lakh jobs annually in the non-farm sector. Focus on increasing productive jobs outside agriculture, especially in organised manufacturing and services.
- Current Workforce Distribution:
- Skill Gap Challenge
- Employability of Youth: 51.25% (improved from 34% in the last decade)
- Challenges in Skill Development:
- Public perception, lack of coordination, inconsistent assessment, paucity of trainers, and demand-supply mismatch.
- Issues like low female labour participation (37.0%), non-inclusion of entrepreneurship in formal education, and inadequate innovation-driven entrepreneurship support.
- Tapping the Full Potential of the Agriculture Sector
- Structural Issues:
- Sustaining growth without causing food price inflation.
- Improving price discovery, efficiency, reducing disguised unemployment, and increasing crop diversification.
- Required Improvements: Upgradation of technology, modern farming skills, better marketing avenues, price stabilisation, and reducing input wastages.
- Structural Issues:
- Easing Compliance and Financing for MSMEs
- Challenges:
- Extensive regulation and compliance requirements.
- Significant bottlenecks in access to affordable and timely funding; credit gap of Rs 20-25 lakh crore (Lok Sabha Standing Committee report, April 2022)
- Threshold-based concessions and exemptions causing unintended effects.
- Government Initiatives: Schemes like Pradhan Mantri Mudra Yojana and Credit Guarantee Fund Trust for MSMEs aimed at providing affordable credit.
- Challenges:
- Managing India’s Green Transition
- Commitments: Reducing GHG emissions by 33-35% (from 2005 levels), increasing non-fossil fuel-based electricity to 40%.
- Enhance forest cover to absorb 2.5 to 3 billion tonnes of CO2 by 2030
- Challenges:
- Ensuring consistency of E-Mobility policy, grid stability, affordable storage technology, and dealing with dependence on China for critical minerals.
- Addressing financing gaps, with the need for 2.5% of GDP to be allocated to green finance (RBI).
- Green Finance Sources:
- Domestic sources: 87% (FY 2019), 83% (FY 2020)
- International sources: 13% (FY 2019), 17% (FY 2020)
- Commitments: Reducing GHG emissions by 33-35% (from 2005 levels), increasing non-fossil fuel-based electricity to 40%.
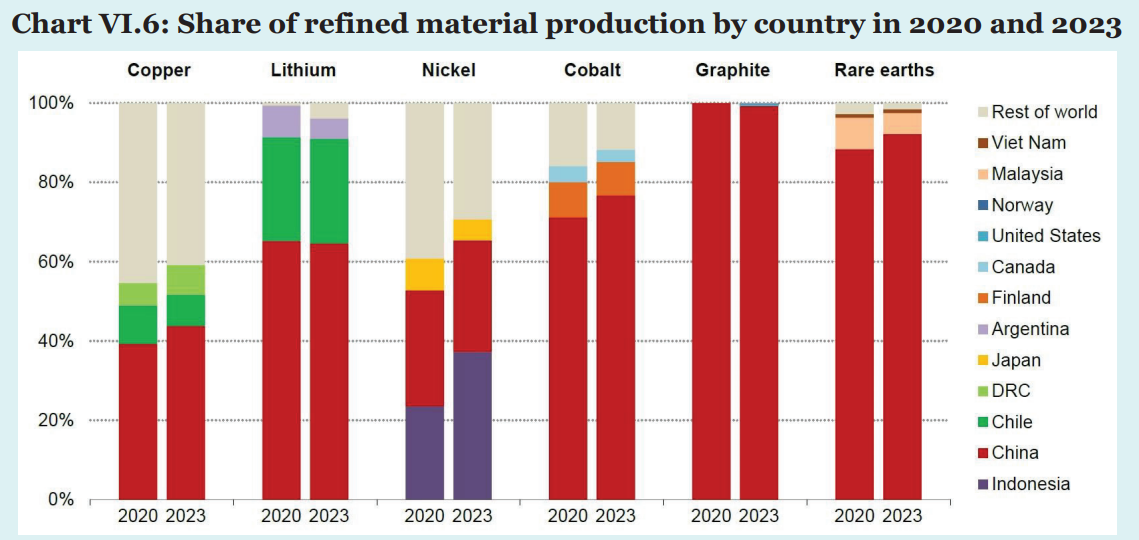
- The Chinese Conundrum
- Complex dynamics with China dominating global supply chains.
- Concerns over India’s dependence on China for critical and rare earth minerals essential for renewable energy.
- Balancing integration into the global supply chain without heavy reliance on China.
- Complex dynamics with China dominating global supply chains.
China's Manufacturing Dominance: A Challenge for Emerging EconomiesEmerging economies (EMEs) are imposing import restrictions on Chinese goods to protect their domestic manufacturers due to China's manufacturing overcapacity, which has led to a global price collapse in various sectors.
|
- Deepening the Corporate Bond Market
- Current State:
- Small size of the corporate bond market compared to other Asian emerging markets (Malaysia, Korea, and China).
- Dominated by highly-rated issuers and a limited investor base.
- Need for Development: Efficient corporate bond market with lower costs and quicker issuing time for longer-term funds.
- Current State:
- Tackling Inequality
- Income Distribution: Top 1% accounts for 6-7% of total incomes, top 10% for one-third of total incomes.
- Policy Focus:
- Creating jobs, integrating the informal sector, expanding the female labour force.
- Tax policies on capital and labour incomes, considering the impact of technology like AI.
- Improving Health of India’s Young Population
- Current Health Issues:
- 56.4% of disease burden due to unhealthy diets (ICMR, April 2024)
- 65% of India's population is under 35.
- 56.4% of disease burden due to unhealthy diets (ICMR, April 2024)
- Rise in consumption of highly processed foods, obesity (Adult obesity rate tripled), and micronutrient deficiencies.
- India's annual rise in children's obesity is among the steepest globally.
- Health Parameters: Need for balanced and diverse diet to leverage demographic divide
- Current Health Issues:
Growth Strategy for Amrit Kaal: Strong, Sustainable, and Inclusive
- Boosting Private Sector Investment
- Focus Areas: Machinery & Equipment, Intellectual Property products.
- Government Initiatives: Aatmanirbhar packages, Production Linked Incentive (PLI), National Infrastructure Pipeline (NIP), National Monetisation Pipeline (NMP), India Industrial Land Bank (IILB), Industrial Park Rating System (IPRS), National Single Window System (NSWS).
- Goal: Increase private sector non-residential investment to sustain efforts towards boosting investment to 35% of GDP.
- Growth and Expansion of India’s Mittelstand (MSMEs)
- Current Contributions: 30% of GDP, 45% of manufacturing output, employment for 11 crore people.
- Government Support: Rs 5 lakh crore Emergency Credit Line Guarantee Scheme (ECLGS), Rs 50,000 crore equity infusion through MSME Self-Reliant India Fund, revised MSME classification criteria, RAMP programme with Rs 6,000 crore outlay, Udyam Assist Platform (UAP).
- Key Challenges: Access to timely and affordable credit.
- Future Directions: Deregulation, physical and digital connectivity, infrastructure upgrades, and targeted training in enterprise management.
- Export Strategy for Mittelstand
- Initiative: Make in India Mittelstand (MIIM) collaboration with Germany.
- Achievements: Supported over 151 German Mittelstand companies, resulting in €1.4 Bn declared investment.
- Focus Areas: Automotive, renewables, construction, consumer goods, electronics, chemicals, waste/water management.
- Strategic Considerations: Balancing trade and investment with China against India’s territorial and non-territorial security.
- Removing Growth Impediments in Agriculture
- Significance: Agriculture's role in food and nutrition security, climate change adaptation and mitigation, sustainable resource use.
- Potential: Employment in horticulture, livestock, fisheries, dairy, and food processing.
- Strategic Shift: Re-imagine agriculture to leverage its importance in physical, food, and economic security amid geopolitical and climatic challenges.
- Financing Green Transition
- Climate Financing Needs: Exploit global green capital from sovereign wealth funds, pensions, private equity, and infrastructure funds.
- Innovative Approaches: Blended finance integrating public and private capital, sector-specific financial institutions to mobilise green funds.
- Potential Role: International Financial Services Centres Authority (IFSCA) to attract international capital for climate finance.
- Bridging the Education-Employment Gap
- Global Megatrends: Automation, climate action, digitalisation changing work and skill demands.
- Policy Frameworks: National Policy on Skill Development & Entrepreneurship (NPSDE), National Education Policy (NEP) 2020 and 2023.
- Focus Areas: Foundational literacy, numeracy, grade-appropriate learning outcomes, employable skills, industry engagement.
- Role of Industry: Collaborate with academic institutions for skilling initiatives.
- Enhancing State Capacity and Capability
- Achievements Since 2014: Delivery of crucial infrastructure, implementation of direct benefit schemes.
- Future Directions: Expand lateral entry into senior ranks, re-imagine training for civil servants, establish accountability mechanisms, annual goal and measurement conversations.
Medium-Term Outlook
- Resilience: India’s growth sustained through multiple global crises with strategic government interventions.
- Growth Path: IMF forecasts 6.8% growth for 2024-25, making India the fastest-growing G20 economy.
- Strategic Goals: Viksit Bharat @2047, building on structural reforms since 2014.
- Citizen Participation: ‘Sabka Prayas’ (everyone’s effort) as a driving mantra for achieving a developed India.
06: Climate Change and Energy Transition: Dealing with Trade-offs
What is the Current Status of India’s Climate Action and Energy Transition Strategy?
- Despite being a rapidly growing economy, India’s per capita carbon emissions are one-third of the global average.
- India aims to achieve a 'Viksit Bharat' or 'Developed India' by 2047 and targets Net Zero carbon emissions by 2070.
- This vision drives the country’s efforts to foster high, inclusive, and environmentally sustainable economic growth.
- Ensuring stable and affordable energy to meet these ambitious goals while maintaining a low-carbon pathway is crucial.
- However, this is challenging due to the need for viable battery storage technologies and access to critical minerals for reliable green energy sources, all while relying heavily on domestic financing.
Present Status of India’s Climate Action - India's Overall Climate Change Strategy
- National Action Plan on Climate Change (NAPCC):
- Principles: High economic growth + Ecological sustainability
- Missions: Nine national missions targeting various sectors:
- National Solar Mission
- National Water Mission
- National Mission for Enhanced Energy Efficiency
- National Mission for a Green India
- National Mission on Sustainable Habitat
- National Mission for Sustainable Agriculture
- National Mission for Sustaining the Himalayan Ecosystem
- National Mission on Strategic Knowledge for Climate Change
- National Mission on Human Health (recently added)
- State Action Plans on Climate Change (SAPCC):
- Current Status: 34 state action plans on climate change operational, outlining sector-specific and cross-sectoral, time-bound priority actions.
Progress on Climate Action
- Solar Power:
- 2023-24 Addition: 15.03 GW
- Cumulative (as of April 30, 2024): 82.64 GW
- Energy Efficiency (Perform Achieve and Trade (PAT) Scheme):
- Eighth Cycle (2023-26):
- Target Sectors: Aluminium, Cement, Chlor-Alkali, Iron & Steel, Pulp & Paper, Textile
- Energy Saving Target: 0.3370 MTOE (million tonnes of oil equivalent)
- Impact: Significant energy savings and GHG emissions reduction
- Eighth Cycle (2023-26):
- Nationally Determined Contributions (NDC):
- Achievements:
- 40% cumulative electrical power installed capacity from non-fossil fuels by 2021
- Reduced emission intensity of GDP by 33% from 2005 levels by 2019
- Updated Targets (August 2022):
- Reduce emissions intensity of GDP by 45% by 2030 (from 2005 levels)
- 50% cumulative electric power installed capacity from non-fossil fuels by 2030
- Current Status (as of May 31, 2024):
- Share of non-fossil sources in installed electricity generation capacity: 45.4%
- Carbon sink: 1.97 billion tonnes of CO2 equivalent (2005-2019)
- Achievements:
- National Communication (NC) to UNFCCC:
- Third National Communication (TNC):
- Energy sector: 75.81% of anthropogenic emissions.
- Agriculture sector: 13.44%.
- Industrial Process & Product Use (IPPU): 8.41%.
- Waste: 2.34%.
- Land Use, Land-Use Change & Forestry (LULUCF): Net sink of 485,472 GgCO2e in 2019.
- Net national emissions in 2019: 26,46,556 GgCO2e.
- Emission Growth (2016-2019):
- Total national emissions increased by 4.56%.
- GDP grew at a CAGR of about 7%, emissions grew at a CAGR of about 4%.
- International Recognition:
- India is the only G20 nation in line with 2℃ warming (International Finance Corporation report).
- Third National Communication (TNC):
Adaptation Actions
- Government Initiatives:
- National Innovations on Climate Resilient Agriculture (NICRA)
- Swachh Bharat Mission
- Mahatma Gandhi National Rural Employment Guarantee Act
- Pradhan Mantri Awas Yojana
- Saubhagya Scheme
- Adaptation Expenditure:
- 2021-22: 5.60% of GDP
- 2015-16: 3.7% of GDP
- Need for Increased Finance: To ease resource constraints
- Coastal Adaptation:
- Ramsar Sites (since 2014):
- 56 new wetlands designated
- Total: 82 sites, 1.33 million ha
- Amrit Dharohar Initiative (2023):
- Promotes nature tourism in Ramsar sites
- Mission Sahbhagita: Participatory conservation (Wetland Mitras), preparation of wetland health cards, engaging communities and private sector
- Ramsar Sites (since 2014):
Community-led Water Governance - Case of NavanagarWater Governance24, a village in Sabarkantha District, Gujarat, faced severe water scarcity with water tables at 500-600 feet and high TDS levels (900-1100 mg/litre), making agriculture unviable.
|
Low Carbon Development and Energy Composition
- Future Energy Demands:
- India’s energy requirements are projected to increase by 2 to 2.5 times by 2047 to support its growing economy and developmental goals.
- The transition to meet these demands must balance resource constraints, climate change resilience, and sustainable development.
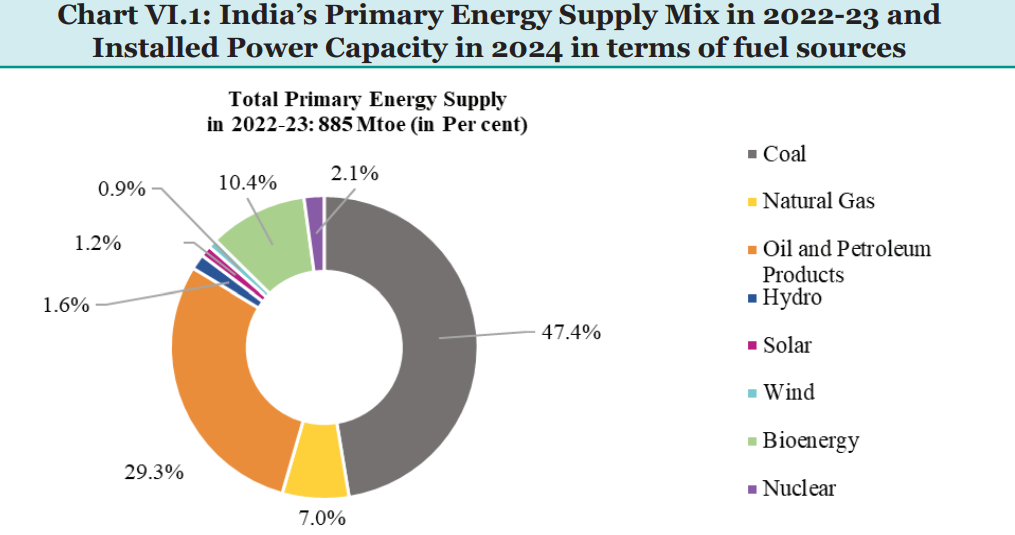
- Current Energy Composition (2022-23):
- Primary Energy Mix: Fossil fuels (coal, oil, and natural gas) constituted approximately 84% of India’s primary energy mix in 2022-23.
- Electricity Sector Composition: The share of non-fossil power capacity increased from around 32% in April 2014 to 45.4% as of May 2024.
- Recent Initiatives in Renewable Energy:
- PM-Surya Ghar Yojana (February 2024):
- Capacity Addition: 30 GW of solar capacity.
- CO2 Reduction: 720 million tonnes.
- Job Creation: Approximately 1.7 million direct jobs.
- Offshore Wind Energy:
- Policy and Rules (2023): National offshore wind energy policy and offshore wind energy lease rules notified.
- Initial Capacity Funding: Viability gap funding for 1GW capacity.
- Green Hydrogen Mission:
- Target: 5 MMT of green hydrogen by 2030.
- Financial Incentives: Boosts electrolyser manufacturing and production.
- Tender Awarded: Strategic Interventions for Green Hydrogen Transition (SIGHT) scheme awarded for 4,12,000 tons capacity.
- PM-Surya Ghar Yojana (February 2024):
- Challenge of Environmental and Resource Management:
- Land and Water Demand: Expanding renewable energy increases demand for land and water, with India having the lowest land availability per capita among G20 countries.
- Renewable Waste Recycling: Solar PV Waste is estimated to be 78 million tonnes by 2050; needs comprehensive policy for managing disposal and recycling.
- Critical Minerals: Concentration of critical minerals like Graphite, Cobalt, rare earth elements, and Lithium is geographically skewed.
- Financial Aspects of Energy Transition:
- Investment Requirements: Approximately USD 250 billion per year needed until 2047 for Net Zero pathways.
- Financing Mechanisms:
- Sovereign Green Bonds: Rs 16,000 Crore issued in January-February 2023 and Rs 20,000 Crore in October-December 2023 for green projects.
- SEBI’s Sustainability Reporting: Enhanced ESG disclosures for top listed entities.
- RBI Initiatives: Framework for Green Deposits and concessional credit for renewable energy through Priority Sector Lending (PSL).
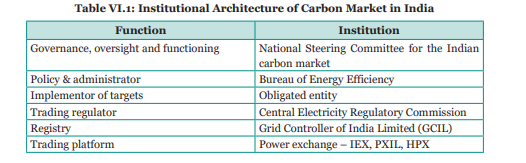
Indian Carbon Market Framework
- Carbon Credit Trading Scheme (CCTS):
- Objective:
- Determine a price for one tonne of carbon dioxide equivalent emissions.
- Encourage entities to account for previously unpriced emission costs.
- Incentivize investment in low-emission technologies.
- Transition:
- CCTS will replace the existing Perform, Achieve, and Trade (PAT) scheme.
- Designated Consumers (DCs) under PAT will gradually shift to CCTS by 2028-2030.
- Mechanism:
- Emission Targets: Government will set entity-wise Greenhouse Gas (GHG) emission intensity targets.
- Compliance: Obligated Entities (OEs) must meet these targets and report compliance within nine months post-compliance cycle.
- Carbon Credit Certificates (CCC):
- Issued for exceeding targets.
- Can be sold or banked for future use.
- Entities not meeting targets must buy CCCs or use banked credits.
- Objective:
- Voluntary Carbon Market (VCM):
- Overview:
- Global Market Size: Over USD 1.2 billion.
- India’s Position: Second-largest supplier of carbon offsets.
- Function:
- Allows entities to offset emissions by funding emission reduction/removal projects elsewhere.
- Offsets can be used to meet personal emission reduction goals.
- Challenges:
- Double Counting: Risk of both sellers and buyers claiming the same carbon reductions.
- Credit Claims: Uncertainty over whether credits used by foreign entities can be simultaneously claimed by the credit-originating country.
- Mission LiFE and Voluntary Actions:
- Aims to address climate change through sustainable living based on conservation and moderation.
- Green Credit Programme (GCP):
- Objective: Encourage environmental actions by offering green credits as rewards.
- Participants: Individuals, communities, private sector industries, and companies.
International Commitments on Climate Finance: Recent Developments
- Current Financial Constraints:
- Estimated Resource Needs: USD 5.8 trillion to USD 11.5 trillion needed by 2030 to meet NDC targets.
- Adaptation Costs: Estimated to be 10 to 18 times greater than the current international adaptation finance flow of USD 21.3 billion.
- Existing Frameworks:
- UNFCCC and Paris Agreement: Mandate developed countries to provide grant or concessional financial resources and technology access to developing nations.
- Currently, most international finance for developing countries is in the form of loans rather than grants.
- India’s Financial Requirements:
- Overall Resource Requirement:
- Nationally Determined Contribution Estimates: USD 2.5 trillion required for 2015-2030.
- Long-Term Low Emission Development Strategy Estimates: Tens of trillions of dollars needed by 2050 for a low-carbon transition.
- Adaptation Communication: Rs 56.68 trillion needed by 2030 for adaptation.
- Domestic vs. International Finance:
- Much of the climate action is funded by domestic resources.
- Developed countries’ emphasis on private finance is debated due to limitations in private capital and its macroeconomic implications.
- Overall Resource Requirement:
- COP 28 and Global Stocktake:
- Outcomes of COP 28:
- Global Stocktake (GST): Aims to increase global climate ambition by 2030. Developed a framework for the Global Goal for Adaptation (GGA), requiring all countries to have adaptation plans by 2030.
- Loss and Damage Fund: Agreement on operationalising the fund and its funding arrangements.
- Adaptation and Mitigation Targets: Calls to scale up adaptation finance and achieve global renewable energy capacity, phase-down coal power, and phase out inefficient fossil fuel subsidies.
- Implementation:
- Actions to be implemented nationally, considering diverse national circumstances.
- Outcomes of COP 28:
- New Collective Quantified Goal (NCQG):
- It is being negotiated under the UNFCCC to set an annual climate finance goal from developed countries to developing countries starting in 2025.
- Baseline: Minimum of USD 100 billion per year.
India’s International Initiatives to Address Climate Change Issues
- International Solar Alliance (ISA)
- Founded: 2015 by India and France.
- Goal: Deploy solar energy solutions and unlock USD 1 trillion in investments by 2030.
- Members: 119 Member and Signatory countries.
- One World, One Sun, One Grid (OSOWOG)
- Objective: Create a massive interconnection of solar energy systems globally.
- Phase 1: Connect Indian grid to Middle East, South Asia, and South-East Asia.
- Phase 2: Extend connections to renewable resources in Africa.
- Phase 3: Achieve global interconnection with a target of 2,600 GW by 2050.
- Coalition for Disaster Resilient Infrastructure (CDRI)
- Launched: September 23rd, 2019, at the UN Climate Action Summit.
- Goal: Enhance resilience of infrastructure to climate and disaster risks.
- Leadership Group for Industry Transition (LeadIT)
- Founded: September 2019 by India and Sweden.
- Objective: Promote industry transition to achieve Paris Agreement goals.
- LeadIT 2.0 (2024-26): Focus Areas:
- Inclusive Industry Transition: Shaping policy frameworks and fostering international cooperation.
- Technology Development: Co-development and transfer of low-carbon technology.
- Financial Support: Supporting industry transition in emerging economies.
07- Social Sector: Benefits That Empower
What is the Current Status of India’s Social Sector?
Context
- With the goal of becoming a developed nation by 2047, India is seeing enhanced quality of life, greater women’s empowerment, and better rural governance.
- This progress highlights India’s commitment to sustainable, equitable development while addressing ongoing and emerging challenges.
Dovetailing Growth with Empowering Welfare: A Paradigm Shift
- Key Developments in Welfare
- Major Welfare Schemes:
- PM Ujjwala Yojana: Over 10.3 crore free gas connections provided.
- Swachh Bharat Mission: 11.7 crore toilets built.
- Jan Dhan Accounts: 52.6 crore accounts opened.
- PM-AWAS Yojana: 3.47 crore pucca houses built for the poor.
- Jal Jeevan Mission: 11.7 crore households provided tap water connections.
- Ayushman Bharat Scheme: 6.9 crore hospital admissions made.
- Pillars of the New Approach to Welfare:
- Cost-Effectiveness: Transforming implementation and effectiveness of Government programs.
- Technology Utilisation: Enhanced fiscal efficiency through DBT and JAM trinity. Over Rs.38 lakh crore transferred via DBT since 2013.
- Outcome Budget: Goal-oriented approach for budgetary allocation.
- Targeted Implementation Reforms:
- Aspirational Districts Programme (ADP): Convergence, collaboration, and competition approach leading to substantial improvements in health, nutrition, education, and infrastructure.
- Other Programs: Aspirational Blocks Programme, Vibrant Villages Programme, Viksit Bharat Sankalp Yatra.
- Corporate Social Responsibility (CSR):
- Mandatory CSR Spending: Section 135 of the Companies Act 2013 requires companies to spend on social purpose programs.
- Major Welfare Schemes:
- Overall Progress and Outcomes
- Improvements in Multidimensional Poverty:
- National Multidimensional Poverty Index (MPI): Estimated by NITI Aayog, measuring health, education, and standard of living.
- Reduction in Poverty: MPI nearly halved from 0.117 (2015-16) to 0.066 (2019-21). 13.5 crore Indians escaped multidimensional poverty.
- Regional Progress: Significant improvements in states like Bihar, MP, UP, Odisha, and Rajasthan.
- Household Consumption Expenditure Survey (HCES) 2022-23:
- Increase in Monthly Per Capita Consumption Expenditure: 40% rise in rural areas and 33.5% in urban areas over 2011-12.
- Gini Coefficient: Decline from 0.283 to 0.266 (rural) and from 0.363 to 0.314 (urban).
- Rural-Urban Divide: Decreased from 83.9% to 71.2%.
- Economic Inequality: Consumption of the lowest 5% grew faster than the top 5%.
- Improvements in Multidimensional Poverty:
- Minding the Mind: Mental Health Scenario
- Rising Prevalence of Mental Health Issues:
- Global Statistics: 970 million people with mental disorders; increase in depressive and anxiety disorders due to Covid-19.
- Indian Context: National Mental Health Survey (NMHS) 2015-16 showed 10.6% prevalence of mental disorders. Higher morbidity in urban areas.
- Mental Health of Children and Youth:
- Global: One in seven 10-19-year-olds with mental disorders.
- India: Increased prevalence among adolescents due to academic pressures, social media, and socio-economic factors.
- Economic Impact of Mental Health: Associated with absenteeism, decreased productivity, and increased healthcare costs.
- Economic Benefits of Mental Health Investment: Investment in mental health has high economic returns.
- In India, studies estimate a return on investment of 6.5 times for the implementation of the Mental Health Care Act 2017
- Related National and State Initiatives: India has made significant strides in mental health policy with the National Mental Health Policy (2014), National Youth Policy (2014), and National Education Policy (2020).
- State-Level Initiatives:
- Meghalaya: State Mental Health Policy aims to train Community Health Centre and school staff to support children and adolescents.
- Delhi: Introduced a Happiness Curriculum for younger students integrating mindfulness, meditation, and values-based education.
- Kozhikode, Kerala: The ‘Our Responsibility to Children’ initiative focuses on teacher, peer, and social mentoring, life skills education, and support for children with special needs.
- State-Level Initiatives:
- Policy Recommendations:
- Increase Psychiatrist Numbers: Raise the number of psychiatrists from 0.75 per lakh population to the WHO norm of 3 per lakh.
- Nurture Peer Support: Strengthen peer support networks and self-help groups to reduce stigma.
- Sensitisation: Initiate mental health sensitisation at the preschool and Anganwadi levels.
- Standardise Private Sector Services: Ensure standardisation in mental health start-ups.
- Rising Prevalence of Mental Health Issues:
Warning Labels on Social Media PlatformsIn India, a 2021 study by the National Commission for Protection of Child Rights found that 23.8% of children use smartphones in bed, and 37.2% have reduced concentration due to smartphone use.
|
- Education Sector Developments
- National Education Policy (NEP) 2020: NEP 2020 aims to provide quality education and prepare youth for the knowledge-driven economy.
- It emphasises foundational literacy, numeracy, multilingual education, and experiential learning.
- School Education Progress:
- Improved Facilities: Enhanced basic facilities in government schools, including toilets, drinking water, and smart classrooms.
- National Curriculum Framework (NCF-SE) 2023: Focuses on competency-based education, vocational education from grade 3, and integrating Indigenous knowledge.
- Higher Education:
- Increased Enrolment: Total enrolment in higher education rose to 4.33 crore in FY22, with significant growth in female enrolment.
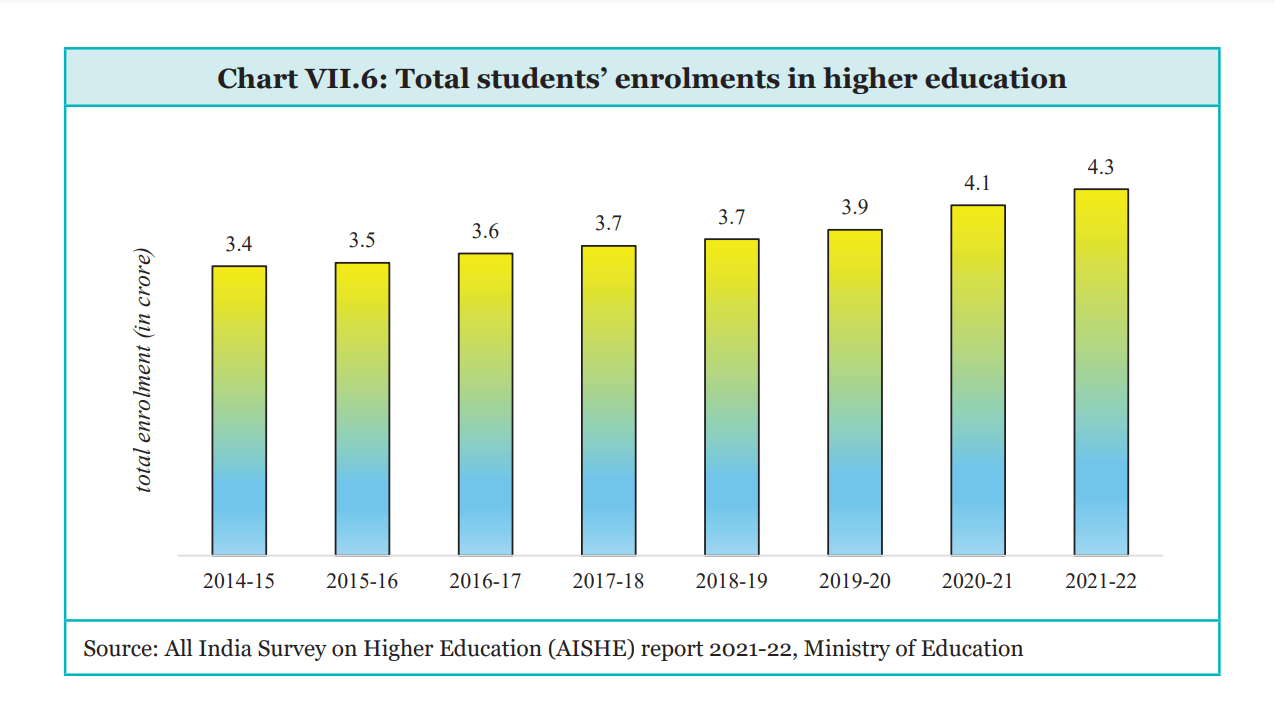
- Increased Enrolment: Total enrolment in higher education rose to 4.33 crore in FY22, with significant growth in female enrolment.
- Digital Transformation in Education:
- National Credit Framework (NCrF): Under NEP 2020, the NCrF supports lifelong learning and includes digital solutions like APAAR and the Academic Bank of Credits (ABC).
- Online Learning: University Grants Commission (UGC) Regulations allow earning up to 40% of credits from online courses.
- National Education Policy (NEP) 2020: NEP 2020 aims to provide quality education and prepare youth for the knowledge-driven economy.
Vidyanjali ProgrammeLaunched on 7th September 2021, the Vidyanjali programme aims to enhance school infrastructure and education quality through community involvement and Corporate social responsibility.
|
- Research and Development (R&D)
- Growth and Investment:
- Patent Grants: Nearly 1 lakh patents were granted in FY24, with a significant increase in patent filings (31.6% growth in 2022).
- Global Innovation Index: India’s rank improved to 40th in 2023.
- Gross Expenditure on R&D (GERD): More than doubled from Rs. 60,196.8 crore in FY11 to Rs. 127,381 crore in FY21.
- Challenges:
- R&D Investment: India’s R&D investment as a percentage of GDP stands at 0.64%, lower compared to China (2.41%) and the US (3.47%).
- Future Directions:
- Strengthen Research-Industry Links: Improve collaboration between higher education, industry, and research institutions.
- Anusandhan Foundation: Launched to enhance the R&D ecosystem with a proposed corpus of Rs.1 lakh crore for research and innovation.
- Growth and Investment:
Empowerment of Women
- Social Empowerment of Women
- Transition to Women-Led Development: India is shifting focus from mere women's development to women-led development.
- India's G20 Presidency in 2023 prioritised 'women-led development,' reflecting global recognition of gender issues.
- Government Initiatives and Budget:
- Gender Budget: Increased from Rs.97,134 crore in FY14 to Rs.3.10 lakh crore in FY25, marking a significant rise.
- Health and Education: Emphasis on improving health and education for the girl child through initiatives like "Beti Bachao, Beti Padhao" and Sukanya Samriddhi Yojana.
- Maternal Health: Programs like Janani Shishu Suraksha Karyakram and PM Matru Vandana Yojana have improved institutional delivery rates and maternal health.
- Nutritional Security:
- Mission Saksham Anganwadi & Poshan 2.0: Focuses on addressing malnutrition through a lifecycle approach and improving Anganwadi services with upgraded facilities and technology.
- Safety and Support:
- Sambal: Includes one-stop centres for women affected by violence and the 24-hour women’s helpline ‘181’ for emergency assistance.
- Education and Skilling:
- Gender parity in school enrolment and a higher female GER in higher education.
- Skilling schemes like PMKVY and Jan Shikshan Sansthan focus on increasing women's participation and training in various sectors.
- Women in Science and Non-Conventional Roles:
- WISE KIRAN: Encourages women’s participation in STEM fields.
- Political Empowerment:
- Nari Shakti Vandan Abhiniyam, 2023 (NSVA): Aims to enhance women’s political participation and improve public goods investment linked to women’s concerns.
- Transition to Women-Led Development: India is shifting focus from mere women's development to women-led development.
- Economic Empowerment of Women
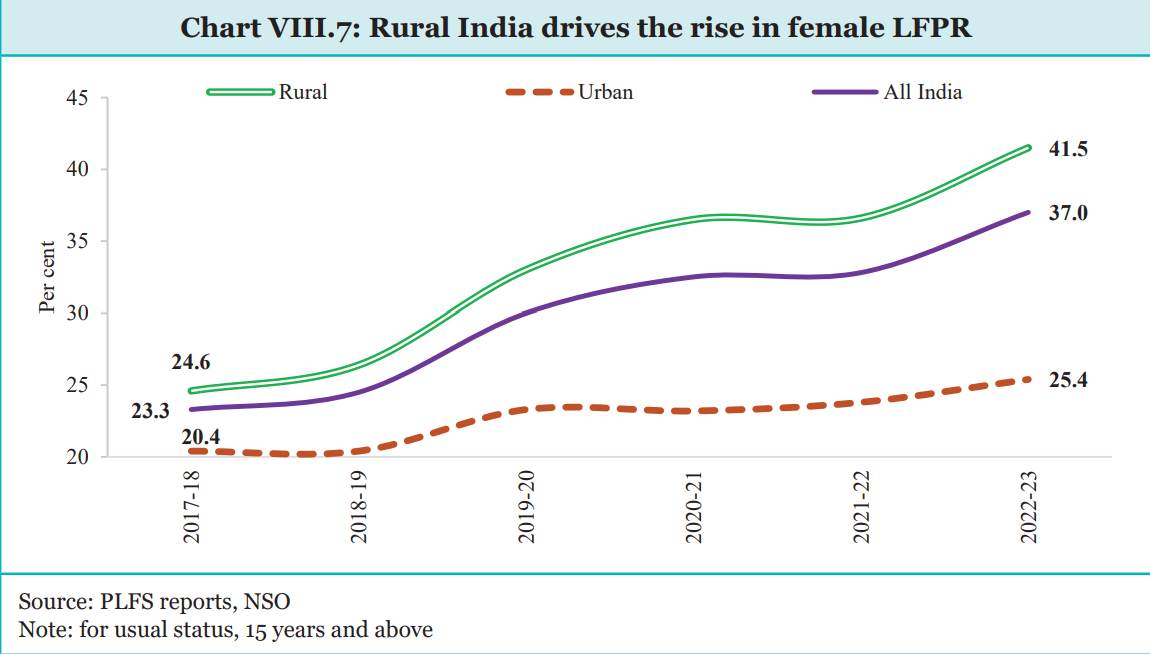
- Labour Force Participation:
- Increase in female Labour Force Participation Rate (LFPR) from 23.3% in 2017-18 to 37% in 2022-23, with a notable rise in rural areas.
- Encouraging trends in sectors like agro-processing for rural women.
- Financial Inclusion:
- PM Jan Dhan Yojana: Facilitated the opening of 52.3 crore bank accounts, with significant female participation and increased deposits.
- Rural Microfinance:
- Deendayal Antyodaya Yojana-NRLM: Empowers women through SHGs, enhancing self-esteem and access to government schemes.
- Successful models include Kudumbashree, Jeevika, and others.
- Deendayal Antyodaya Yojana-NRLM: Empowers women through SHGs, enhancing self-esteem and access to government schemes.
- Entrepreneurship:
- Female entrepreneurs have benefitted from schemes like PM Mudra Yojana and Stand-Up India, with substantial female participation.
- Labour Force Participation:
Rural Economy: Driving the Growth Engine
- Key Areas of Focus:
- Welfare services (school infrastructure, primary healthcare centers)
- Technology solutions for governance issues
- Improved transport and communication
- Strengthening Mahatma Gandhi National Rural Employment Guarantee Scheme
- Objective:
- MGNREGA: Provides at least 100 days of guaranteed wage employment annually to rural households
- Efficiency Reforms:
- Geotagging: Before, during, and after work
- Payments: 99.9% through National Electronic Fund Management System
- DBT and Aadhaar-Based Payments: Enabled for 98.6% of active workers
- Social Audit Units: Established in 28 states/UTs
- Evolution:
- From Wage Employment to Asset Creation: Individual beneficiary works on land rose from 9.6% in FY14 to 73.3% in FY24
- Capacity Development: Initiatives like BareFoot Technicians (BFT) and UNNATI skilling project.
- Objective:
- Nurturing Rural Entrepreneurship
- Government Schemes for Rural Entrepreneurship:
- Deendayal Antyodaya Yojana-National Rural Livelihood Mission (DAY-NRLM):
- Objective: Empower poor households for self-employment and skilled wage employment
- Enterprises Supported: Solar panels, sanitary pads, soaps, detergents, etc.
- Lakhpati Didis Initiative (2023):
- Target: Uplift three crore SHG households to minimum annual income of Rs.1 lakh within three years
- Saras Aajeevika Portal and eSARAS Mobile App (2023):
- Purpose: Showcase and sell handcrafted products by SHGs
- Start-Up Village Entrepreneurship Programme (SVEP) and Aajeevika Grameen Express Yojana (AGEY):
- SVEP: Supports local enterprises, provides start-up loans
- AGEY: Provides community-monitored transport services to rural areas
- Rural Self Employment Training Institute (RSETI) Scheme:
- Purpose: Provide skill training, credit assistance, and mentorship
- Coverage: 50.72 lakh trained candidates, 36.23 lakh settled entrepreneurs/apprentices
- Financing Rural Entrepreneurship:
- NABARD: Supports Micro Entrepreneurship Development Programmes (MEDPs) and Livelihood & Enterprise Development Programmes (LEDPs)
- Funding: Rs.52.39 crore for MEDPs, Rs.106.10 crore for LEDPs
- Deendayal Antyodaya Yojana-National Rural Livelihood Mission (DAY-NRLM):
- Government Schemes for Rural Entrepreneurship:
Towards Sustainable Development
- Embracing SDGs:
- India is actively adopting and championing the Sustainable Development Goals (SDGs) to enhance welfare and quality of life for its citizens.
- Despite global economic challenges, India has demonstrated resilience and commitment towards achieving the 2030 Agenda.
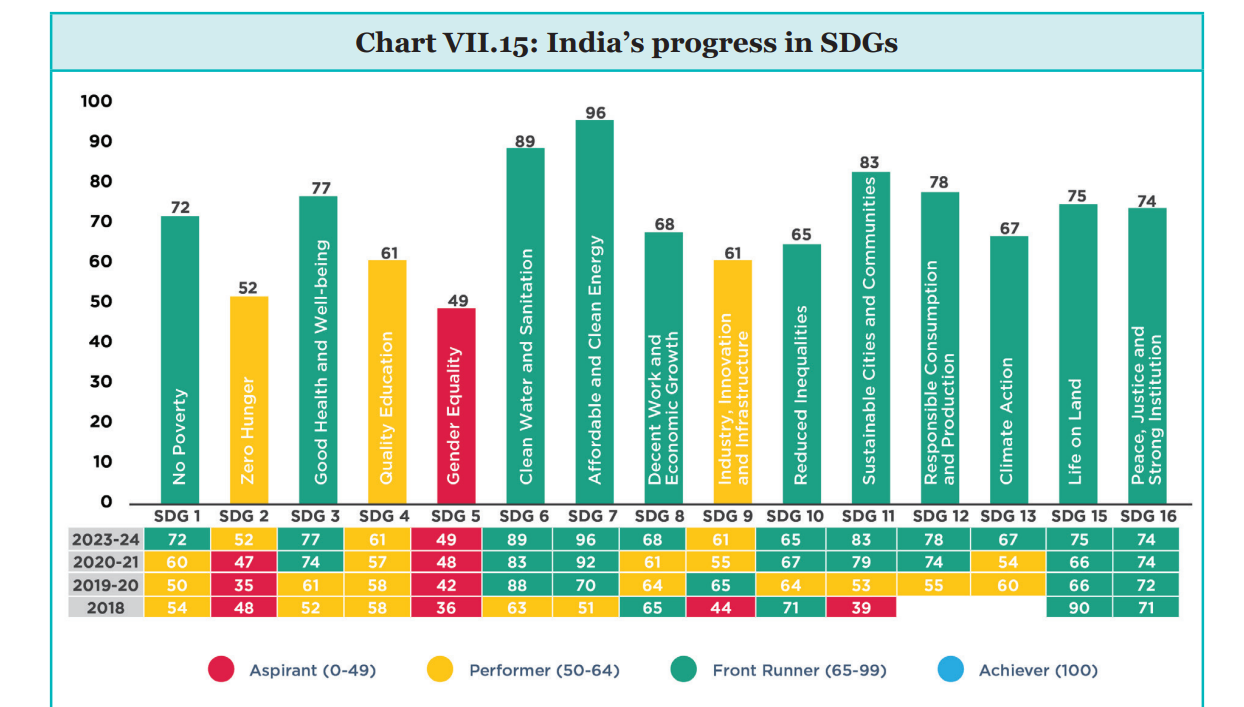
- SDG India Index Scores:
- 2020-21: 66
- 2023-24: 71
08: Employment and Skill Development: Towards Quality
What is the Current Status of Employment and Skill Development in India?
Context
- The Indian labour market has shown significant improvement over the past 6 years, with the unemployment rate dropping to 3.2% in 2022-23.
- The manufacturing sector has rebounded, with rising factory employment and upscaling of operations.
- Formal employment growth is robust, evidenced by a doubling of EPFO payroll additions.
- However, the job market must adapt to technological advancements, particularly artificial intelligence, while ensuring collective welfare.
- Also, despite progress in skilling, only 4.4% of the young workforce is formally skilled, indicating scope for further improvement.
Current Employment Scenario
- Unemployment and Employment Metrics
- Unemployment Rate (UR):
- Trend: The all-India annual unemployment rate (UR), for individuals aged 15 years and above based on the usual status, has been declining since the Covid-19 pandemic.
- Labour Force Participation Rate (LFPR) and Worker-to-Population Ratio (WPR)
- Quarterly Data: The quarterly PLFS reports for urban areas reveal that:
- The unemployment rate for people aged 15 years and above is 6.7% in the quarter ending March 2024.
- This is a slight decrease from 6.8% in the same quarter of 2023.
- There has been an increase in both the WPR and LFPR, reflecting a recovery in employment post-pandemic.
- The unemployment rate for people aged 15 years and above is 6.7% in the quarter ending March 2024.
- Quarterly Data: The quarterly PLFS reports for urban areas reveal that:
- Unemployment Rate (UR):
- Workforce Composition
- Estimated Workforce Size
- 2022-23 Estimate: India’s workforce was approximately 56.5 crore.
- Employment Distribution by Sector
- Agriculture: 45% of the workforce.
- Manufacturing: 11.4% of the workforce.
- Services: 28.9% of the workforce.
- Construction: 13% of the workforce.
- Estimated Workforce Size
- Employment Status
- Breakdown of Employment Status
- Self-Employed: 57.3% of the total workforce.
- Unpaid Workers in Household Enterprises: 18.3%.
- Casual Labour: 21.8%.
- Regular Wage/ Salaried Workers: 20.9%.
- Gender Differences
- Female Workforce: There has been a noticeable shift of the female workforce towards self-employment.
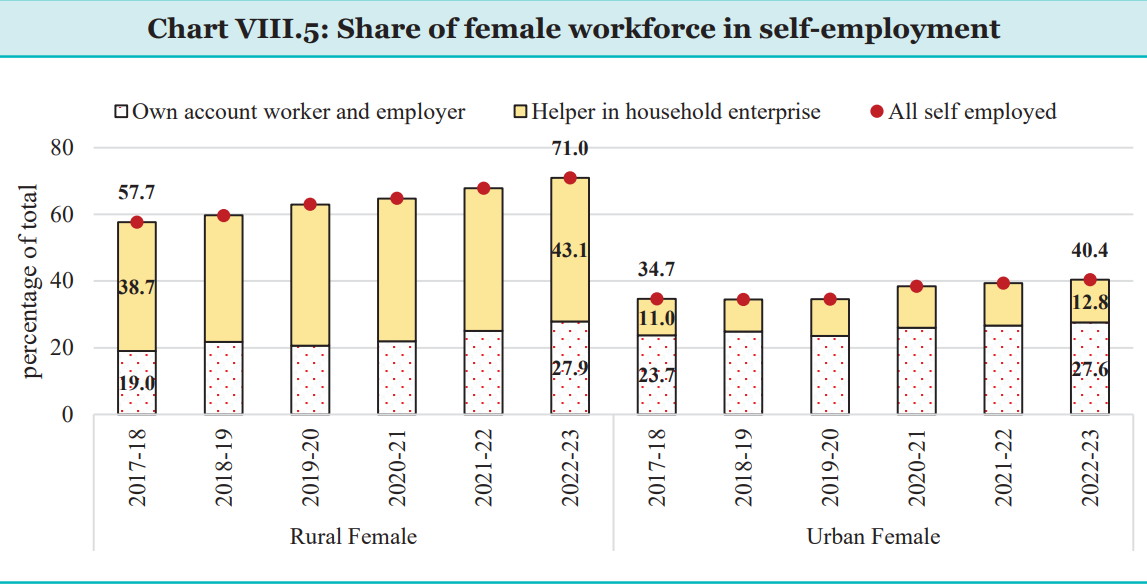
- Male Workforce: The proportion of male workers in different employment statuses has remained relatively stable.
- Female Workforce: There has been a noticeable shift of the female workforce towards self-employment.
- Breakdown of Employment Status
Youth and Female Employment in India
- Youth Employment
- Youth Unemployment Rate
- Trend: The annual youth (age 15-29 years) unemployment rate has significantly declined.
- 2017-18: 17.8%
- 2022-23: 10%
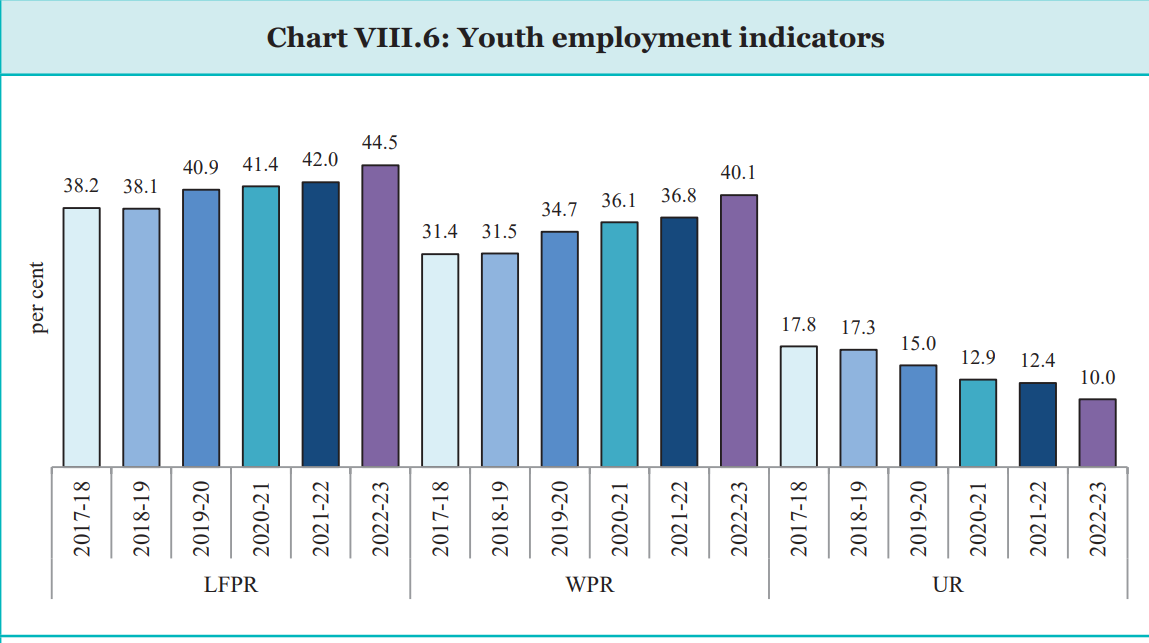
- Trend: The annual youth (age 15-29 years) unemployment rate has significantly declined.
- Formal Employment Growth
- EPFO Data: Reflects the rise in youth employment.
- Trend: The annual new EPF subscribers aged 18-28 years have been increasing post-Covid-19 pandemic.
- Current Status: Nearly two-thirds of new EPFO payroll subscribers are in the 18-28 years age band.
- EPFO Data: Reflects the rise in youth employment.
- Youth Unemployment Rate
- Female Labour Force Participation Rate (FLFPR)
- FLFPR Trends: The FLFPR has been rising for the past six years.
- Rural FLFPR: Increased by 16.9% points from 2017-18 to 2022-23, highlighting the growing contribution of women to rural production.
- FLFPR Trends: The FLFPR has been rising for the past six years.
- Employment in Factories
- Manufacturing Sector Resilience
- Annual Survey of Industries (ASI): Shows recovery in employment post-pandemic.
- 2020-21: Slight fall in employment.
- 2021-22: Employment in the organized manufacturing sector surpassed pre-pandemic levels.
- Employment Per Factory: Continued to rise, with wages per worker increasing.
- Annual Survey of Industries (ASI): Shows recovery in employment post-pandemic.
- Wage Growth
- Rural Areas (FY15-FY22): Wages per worker grew at a 6.9% CAGR.
- Urban Areas (FY15-FY22): Wages per worker grew at a 6.1% CAGR.
- Top States by Factory Employment: Tamil Nadu, Gujarat, and Maharashtra account for over 40% of factory employment.
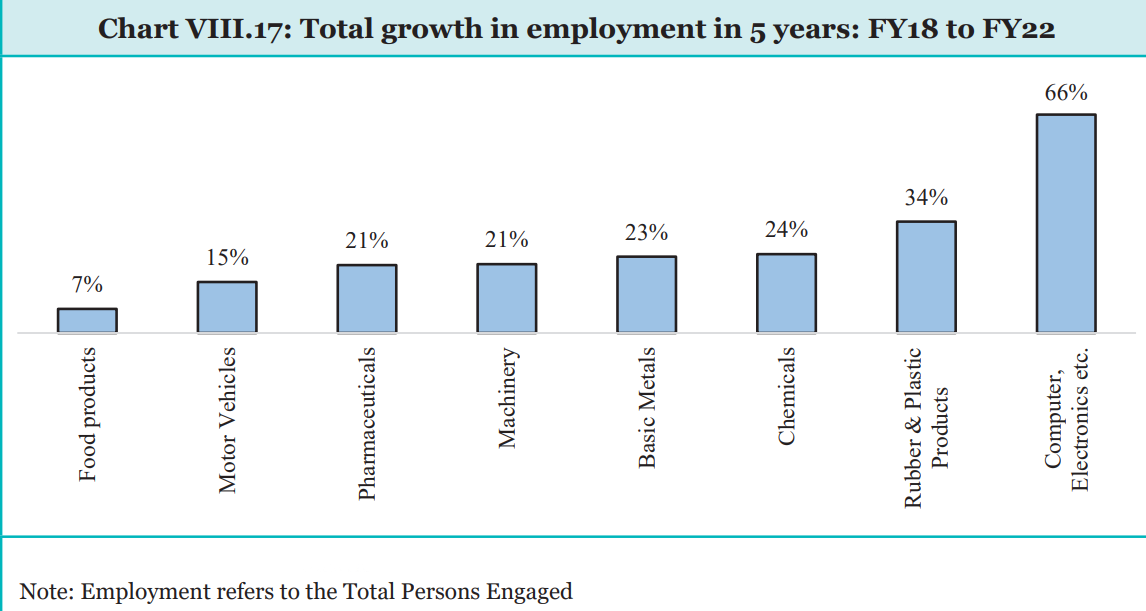
- Highest Employment Growth (FY18-FY22): States with a higher share of young population, including Chhattisgarh, Haryana, and Uttar Pradesh.
- Factory Size Trends
- Small Factories (2021-22): Factories employing less than 100 people constituted 79.2% of all factories but only contributed 22.1% of total employment.
- Growth in Larger Factories: Factories employing more than 100 workers grew by 11.8% from FY18 to FY22.
- Sectoral Employment Share
- Largest Employers: Food products (11.1%), textiles, primary metals, wearing apparel, and motor vehicles.
- Emerging Sectors: Computers and electronics, rubber and plastic products, and chemicals.
- Manufacturing Sector Resilience
- Government Initiatives to Boost Employment
- Production Linked Incentive (PLI) Scheme
- Self-Employment Promotion
- National Career Service (NCS) Portal
- Includes 407 Model Career Centres and over 46,000 job fairs.
- e-Shram Portal
- National database of unorganised workers with over 29 crore registered workers.
- Integrated with NCS portal to facilitate job search and access to Central Government schemes.
- Aatmanirbhar Bharat Rojgar Yojana (ABRY)
- Benefited 60.5 lakh individuals across 1.5 lakh establishments by March 2024.
- Contributory Pension Schemes
- Atal Pension Yojana (APY): Over 6.5 crore subscribers.
- Pradhan Mantri Shram Yogi Maan-Dhan (PM-SYM): Over 50 lakh workers enrolled.
- Affordable Insurance Programs
- Pradhan Mantri Jeevan Jyoti Bima Yojana (PMJJBY): Rs. 2 lakh life cover at an annual premium of Rs. 436.
- Pradhan Mantri Suraksha Bima Yojana (PMSBY): Rs.2 lakh disability cover at an annual premium of Rs.20.
- PM Street Vendor’s Atma Nirbhar Nidhi (PM SVANidhi) Scheme
- Provides collateral-free working capital loans to street vendors, benefiting over 64 lakh individuals.
- One Nation One Ration Card Programme
- Enhances migrant workers' welfare by allowing portable food security across India with over 124 crore portability transactions till December 2023.
- Deendayal Antyodaya Yojana – National Urban Livelihoods Mission (DAY-NULM)
- Aims to reduce urban poverty by providing self-employment and skilled wage employment opportunities, benefiting 5.48 lakh individuals from 2018-19 to January 2024.
- Trend in Rural Wages
- FY24 Rural Wages
- Growth Rate: Nominal wage rates in agriculture grew by 7.4% for men and 7.7% for women.
- Non-Agricultural Wages: Grew by 6.0% for men and 7.4% for women.
- Inflation Impact: Expected to lead to a sustained rise in real wages as inflation eases.
- FY24 Rural Wages
The Evolving Landscape of Jobs in India
The landscape of jobs in India is undergoing a significant transformation influenced by various factors such as technological advancements, the transition towards a greener economy, and the rise of the gig economy.
- Fourth Industrial Revolution and Technological Advancements
- Disruption and Reskilling: The global labour market is experiencing a significant disruption driven by the fourth industrial revolution.
- Technological advancements, including AI, machine learning, IoT, big data, and automation, are reshaping how work is done.
- Impact of AI: AI, recognized as a general-purpose technology, has the potential to both boost productivity and disrupt employment in certain sectors.
- The exposure to AI in India is estimated at 26%, divided into high and low complementarity roles.
- Disruption and Reskilling: The global labour market is experiencing a significant disruption driven by the fourth industrial revolution.
- Rise of the Gig Economy
- Growth and Characteristics: The gig economy, comprising freelancers, platform workers, and self-employed individuals, is expanding rapidly in India, driven by technological platforms, increased internet access, and the demand for flexible work arrangements.
- In 2020-21, around 7.7 million workers were part of the gig economy, constituting 2.6% of the non-agricultural workforce.
- Future Projections: The gig workforce is expected to grow to 23.5 million by 2029-30, forming 6.7% of the non-agricultural workforce.
- Growth and Characteristics: The gig economy, comprising freelancers, platform workers, and self-employed individuals, is expanding rapidly in India, driven by technological platforms, increased internet access, and the demand for flexible work arrangements.
- Climate Change and Green Energy Transition
- Job Losses and Productivity Impact: Climate change poses a significant risk to job security and productivity, especially in agriculture and construction.
- High temperatures are expected to result in substantial working hour losses and economic impacts.
- Green Job Creation: Efforts to mitigate climate change through green technologies are creating job opportunities in the renewable energy sector.
- By 2030, clean energy initiatives could create around 3.4 million jobs in solar and wind energy sectors in India.
- Health and Safety Concerns: Climate change also affects worker well-being, particularly for manual labourers exposed to extreme weather conditions. Innovative solutions, like SEWA’s heat-linked parametric insurance, are being implemented to protect workers' health and incomes.
- Job Losses and Productivity Impact: Climate change poses a significant risk to job security and productivity, especially in agriculture and construction.
- Policy Recommendations and Future Directions
- AI Research and Development: India needs to enhance its research and development in this sector.
- The US, for instance, has a strategic plan for strengthening its AI sector, which India could emulate.
- Skill Development and Education: To leverage the opportunities presented by AI and technological advancements, India needs to focus on skill development.
- This includes analytical thinking, innovation, complex problem-solving, and adaptability.
- Social Security for Gig Workers: The rise of the gig economy necessitates the expansion of social security benefits to gig and platform workers. The Code on Social Security (2020) is a step in this direction.
- Encouraging Green Jobs: Policies that support the transition to green jobs and protect workers from the impacts of climate change are crucial.
- This includes investments in renewable energy and insurance products for climate-related risks.
- AI Research and Development: India needs to enhance its research and development in this sector.
Job Creation Requirements Until 2036
- Current Workforce and Future Projections
- Workforce Participation Rate (WPR):
- Men: Constant at 54.4% (2023).
- Women: Rising from 27.0% (2023) to 40.0% (2036), increasing by 1% point annually.
- Agriculture Sector: Expected to decline from 45.8% (2023) to 25% (2047).
- Annual Job Creation Needed: Approximately 78.5 lakh jobs in the non-farm sector until 2030.
- Workforce Participation Rate (WPR):
- Key Focus Areas- Agro Processing and Care Economy
- Agro-Processing Sector for Rural Employment
- Opportunities and Benefits
- Current Processing Levels: Low in India compared to global standards (e.g., 4.5% for fruits).
- Rising Demand: Increased affluence and diet-consciousness are driving demand for processed food.
- Success Stories: Examples include Sahyadri Farmer Producer Company, Araku Coffee plantations, and SEWA's spice-processing group.
- Potential Benefits
- Rural Growth: Can accelerate crop diversification and provide productive employment.
- Avenues: Can supply local units like Aanganwadis, mid-day meal programs, and export markets.
- Program Synergies: Benefits from integrating Mega Food Park, Skill India, Mudra, and other existing schemes.
- Opportunities and Benefits
- Care Economy:
- Categories:
- Compensated Care Work: Nurses, caregivers, etc.
- Unpaid/Underpaid Care Work: Household caregiving, childcare, elderly care, predominantly performed by women.
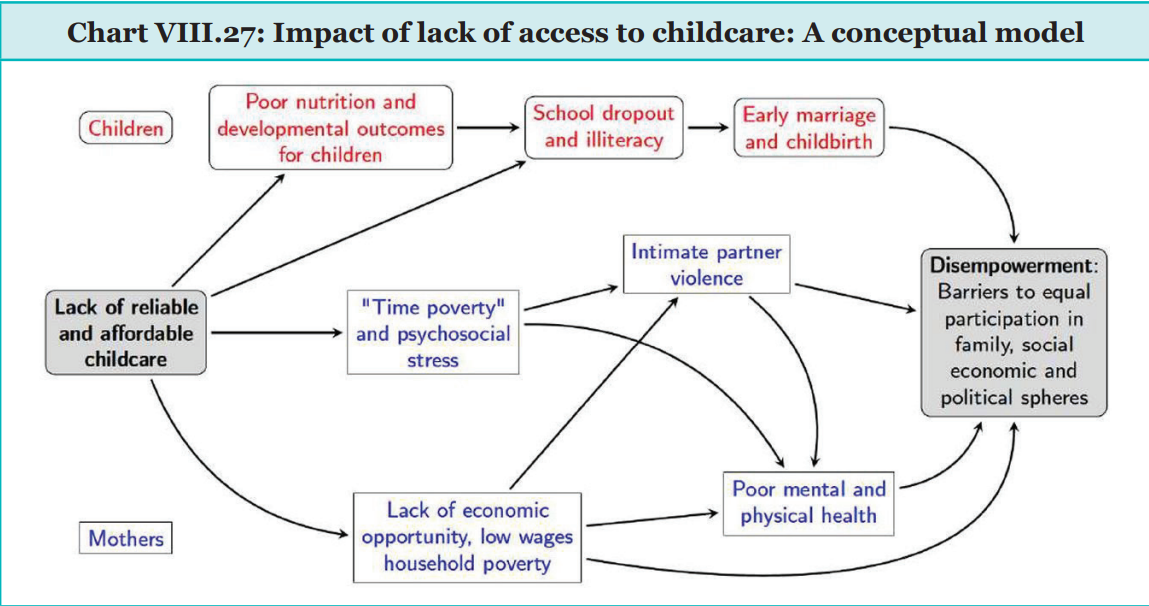
- Need for a Developed Care Economy
- Demographic Transition: Increasing elderly population and need for care.
- Gender Equity: Reducing the burden of unpaid care work to increase female labor force participation.
- Economic Potential: Investing in care services could generate substantial employment and economic benefits.
- Empirical Evidence
- International Examples: Successful care programs in Mexico and Brazil.
- Categories:
- Government Initiatives
- Palna Scheme: Revisions under Mission Shakti aim to establish 17,000 Anganwadi-cum-Crèches.
- Senior Care Reforms: Need for a structured policy to address elderly care, including infrastructure, research, and know-how.
- Agro-Processing Sector for Rural Employment
Developments and Progress in Skilling
- Skills Improvement (2017-18 to 2022-23):
- Increased Skilled Workforce: There has been significant progress in skill acquisition across various socio-economic groups, including rural and urban areas and different genders.
- Training Data: As per the Periodic Labour Force Survey (PLFS) 2022-23:
- 4.4% of youth aged 15-29 years received formal vocational/technical training.
- 16.6% received informal training.
- Schemes and Their Progress:
- PM Vishwakarma Scheme:
- Purpose: To support artisans and craftspeople, enhancing their enterprises and modernising traditional vocations.
- Pradhan Mantri Kaushal Vikas Yojana (PMKVY):
- Training: 14.27 million persons trained since 2015.
- Certification: 11.37 million certified.
- Reforms: Emphasis on industry relevance, on-the-job training, and increased participation of women (52.3% in FY24).
- Craftsmen Training Scheme at ITIs:
- Enrollment: 124,000 persons enrolled (2014-2023).
- Gender Participation: Increased from 9.8% in FY16 to 13.3% in FY24.
- New Grading: Data-driven grading methodology implemented from 2023-24.
- Jan Shikshan Sansthan (JSS):
- Training: 26.37 million trained, 24.95 million certified (FY19-FY24).
- Women Beneficiaries: 82% of total beneficiaries.
- Capacity Building: Setting up Model JSS, upgrading labs, and training staff.
- National Apprenticeship Promotion Scheme (NAPS):
- Apprentices: 32.38 million engaged (FY17-FY24).
- Women Participation: Increased from 7.74% (2016-17) to 20.77% (2023-24).
- Stipend Support: Rs.320.88 crore released through 22.46 million transactions.
- Skill India Digital Hub Platform:
- Features: Integrates various skilling schemes, online courses, and digital services.
- Engagement: 6 million learners registered, 8.4 million app downloads.
- PM Vishwakarma Scheme:
09: Agriculture and Food Management: Plenty of Upside Left If We Get It Right
What is the Current Status of India’s Agriculture and Allied Sector?
Context
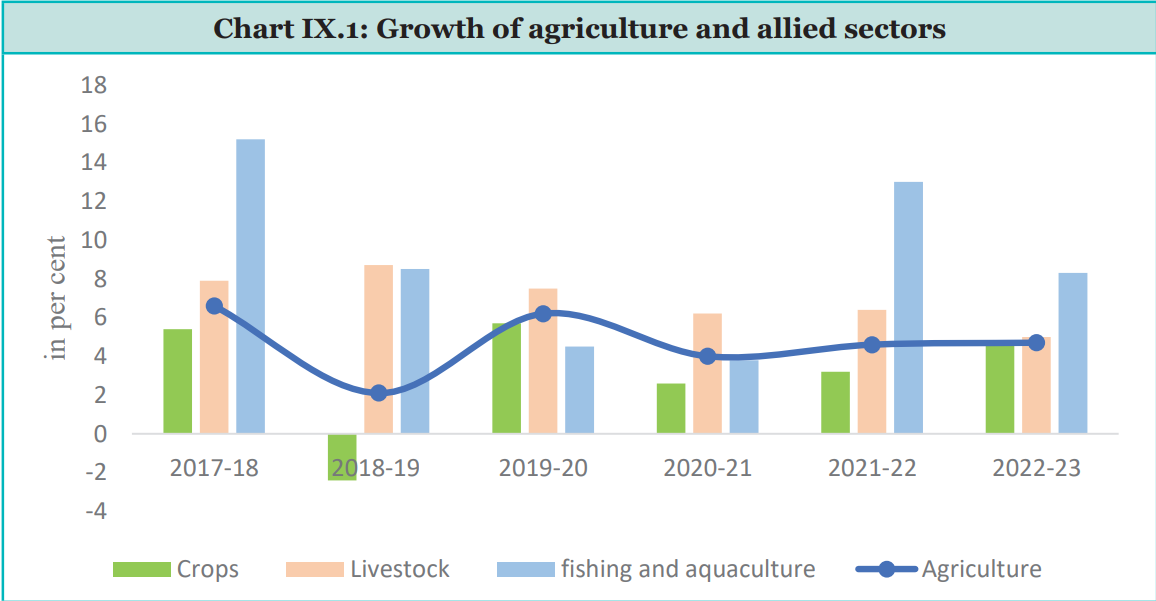
- India’s agriculture sector has grown at 4.18% annually over the past five years, supporting 42.3% of the population and contributing 18.2% to GDP.
- Despite this growth, challenges such as low productivity, fragmented land holdings, and inadequate infrastructure persist.
- Government interventions aim to address these issues through measures like the Minimum Support Price (MSP), improved access to credit, and support for sustainable practices.
- The Pradhan Mantri Kisan Samman Nidhi (PM KISAN) provides financial aid to farmers, while schemes like Per Drop More Crop (PDMC) and the National Mission on Sustainable Agriculture (NMSA) focus on efficiency and sustainability.
- In addition to crops, allied sectors like livestock and fisheries are crucial. Programs such as the Rashtriya Gokul Mission and Pradhan Mantri Matsya Sampada Yojana (PMMSY) aim to enhance productivity and infrastructure, with the fisheries sector showing a notable growth rate of 7.4% annually from 2020-21.
Agriculture Production: Performance and Promoting Crop Diversification
- Performance Overview
- Foodgrain Production: In 2022-23, foodgrain production reached a record 329.7 million tonnes, but slightly decreased to 328.8 million tonnes in 2023-24 due to adverse monsoon conditions.
- Oilseeds Production: Rose to 41.4 million tonnes in 2022-23, with a slight increase in 2023-24.
- Nutri-Cereals: Increased by 1% from 2023.
- Tur Production: Estimated at 33.85 lakh tonnes, up from 33.12 lakh tonnes.
- Lentil Production: Estimated at 17.54 lakh tonnes, higher by 1.95 lakh tonnes compared to 2023.
- Crop Diversification Initiatives
- Government Programs:
- Crop Diversification Programme (CDP): Under Rashtriya Krishi Vikas Yojna (RKVY), this program promotes alternative crops like pulses and legumes to replace water-intensive paddy cultivation.
- National Food Security Mission (NFSM): Enhances production and productivity of foodgrains and commercial crops through technology demonstration and capacity building.
- Minimum Support Prices (MSP): Increased MSPs for oilseeds and pulses to encourage diversification. For example:
- Lentils (Masur): MSP is 89% over production cost.
- Tur: MSP is 58% over production cost.
- Coarse cereals (e.g., Bajra): MSP is 82% over production cost.
- Safflower and Soybean: MSPs are 52% over production cost.
- Government Programs:
- Oilseeds and Oil Palm
- National Food Security Mission- Oilseeds & Oil Palm (NFSM-OS&OP): Implemented from 2018-19 to improve vegetable oil availability.
- Area Coverage: Increased from 25.60 million hectares in 2014-15 to 30.08 million hectares in 2023-24 (17.5% growth).
- Domestic Availability: Rose from 86.30 lakh tonnes in 2015-16 to 121.33 lakh tonnes in 2023-24.
- Imported Oil Share: Reduced from 63.2% in 2015-16 to 57.3% in 2022-23.
- National Food Security Mission- Oilseeds & Oil Palm (NFSM-OS&OP): Implemented from 2018-19 to improve vegetable oil availability.
- Investment and Credit
- Gross Capital Formation (GCF):
- Growth: Increased by 19.04% in 2022-23. GCF as a percentage of GVA rose from 17.7% in 2021-22 to 19.9% in 2022-23.
- Annual Growth Rate: Average of 9.70% from 2016-17 to 2022-23.
- Challenges:
- Need for a 12.5% annual growth in agriculture investment to double farmers' income.
- Fragmented landholdings and low private sector investment are key challenges.
- Gross Capital Formation (GCF):
- Subsidies and Support
- Subsidies:
- Increased significantly from 2011-12 to 2020-21, with major increases in fertiliser and power subsidies.
- Subsidies have more than doubled, but public investment remains about one-third of subsidies.
- Agriculture Marketing Infrastructure (AMI):
- Capital Subsidy: 25% for plains and 33.33% for North-East and hilly regions.
- Projects: 48,357 projects sanctioned with Rs 4570 Crore released as subsidy.
- Subsidies:
- Access to Credit
- Kisan Credit Card (KCC):
- Issued: 7.5 crores KCC with a limit of Rs 9.4 lakh crores as of 31st January 2024.
- Extension: Includes fisheries and animal husbandry since 2018-19.
- Kisan Credit Card (KCC):
- Insurance Schemes
- Pradhan Mantri Fasal Bima Yojana (PMFBY):
- Insured Area: Reached 610 lakh hectares in 2023-24.
- Challenges: High premiums, delays in claim settlement, and lack of awareness.
- Pradhan Mantri Fasal Bima Yojana (PMFBY):
- Agriculture Marketing
- e-NAM Scheme:
- Registration: More than 1.77 Crore farmers and 2.56 Lakh traders.
- Benefits: Better pricing, reduced transaction costs, and enhanced efficiency.
- Challenges: Limited awareness and infrastructure issues.
- e-NAM Scheme:
- Assured Remunerative Prices and Income Support
- Minimum Support Price (MSP): Guaranteed at least 1.5 times the cost of production for various crops since 2018-19.
- PM-KISAN Scheme: Provides Rs 6000 per year to land-holding farmers, with over Rs 3.24 lakh Crore released to more than 11 crore farmers.
- PM-Kisan Maandhan Yojna (PMKMY): Offers a monthly pension of Rs 3,000 to farmers aged 60 and above.
- Farm Mechanization
- Sub Mission on Agricultural Mechanization (SMAM):
- Funds: Rs.7.26 Thousand Crore allocated from 2014-15 to 2023-24.
- Sub Mission on Agricultural Mechanization (SMAM):
- Sustainable Agriculture
- National Mission for Sustainable Agriculture (NMSA): Enhances productivity and resilience through initiatives like Rainfed Area Development (RAD) and Pradhan Mantri Krishi Sinchayee Yojana (PMKSY).
- Micro Irrigation Fund (MIF): Rs 5 Thousand Crore corpus to expand micro irrigation coverage.
- Fertiliser Use: Promotion of balanced fertiliser use and organic farming through schemes like PKVY and MOVCDNER.
- Crop Residue Management
- Scheme: Supports Punjab, Haryana, Uttar Pradesh, and NCT of Delhi in managing crop residue to reduce air pollution.
- Bio-Decomposer Use: Applied to 7.00 lakh hectares in 2023.
Allied Sectors: Animal Husbandry, Dairying, and Fisheries
- Growth and Contribution:
- The contribution of livestock to the total GVA (at constant prices) in agriculture and allied sectors increased from 24.32% in 2014-15 to 30.38% in 2022-23
- The fisheries sector, crucial to the Indian economy, contributes 6.72% to the agricultural GVA, with a CAGR of 8.9% over the same period. It supports about 30 million people, including marginalised communities.
- Government Initiatives:
- The Livestock Health and Disease Control Programme and the National Livestock Mission focus on animal health and productivity.
- The Animal Husbandry Infrastructure Development Fund (AHIDF) supports investments in dairy and meat processing, feed plants, and breed improvement, with a 3% interest subsidy and a 25% credit guarantee.
Agricultural Research and Education
- Investment and Returns:
- Investment in agriculture research has shown a high return of Rs 13.85 for every rupee spent.
- ICAR and Innovations:
- The Indian Council on Agricultural Research (ICAR) has been pivotal in diverse areas, including crop and seed production, bio-fortified varieties, millets, animal health, mechanisation, and post-harvest management.
- In 2022-23, ICAR released 347 varieties/hybrids of 44 crops, 99 horticultural crops, and 27 bio-fortified varieties.
Food Processing Sector (FPI): Processing Potential
- Sector Overview:
- India is a leading producer of milk, fruits, vegetables, and sugar, creating a strong foundation for a robust food processing industry.
- The sector is a major employer, with a 12.02% share in organised manufacturing employment.
- Growth and Export:
- The food processing industry has been growing at an average annual rate of 5.35% over the past 8 years.
- In 2022-23, agri-food exports, including processed foods, were valued at USD 46.44 billion, making up about 11.7% of India’s total exports.
- The share of processed food exports increased from 14.9% in 2017-18 to 23.4% in 2022-23.
- Government Initiatives:
- Production Linked Incentive Scheme for Food Processing Industry (PLISFPI): Aims to develop global food manufacturing champions, branding, and marketing abroad.
- PM Formalization of Micro Food Processing Enterprises (PMFME): Provides credit-linked subsidies and capacity building.
- Operation Green: Initially focused on tomato, onion, and potato (TOP), now covers 22 perishable crops (TOTAL).
- It includes short-term price stabilisation measures and long-term integrated value chain development projects with subsidies for transportation, storage, and food processing projects.
Food Management: Social Net for Food Security
- Objectives:
- Procurement: Buying food grains from farmers at remunerative prices.
- Distribution: Providing foodgrains to vulnerable sections at affordable prices.
- Buffer Stocks: Maintaining reserves for food security and price stability.
- Procurement and Distribution:
- Procurement: As of May 2024, 263.33 LMT of wheat and 489.20 LMT of rice have been procured, benefiting over 1 crore farmers.
- The central pool's stock of wheat and rice exceeds 600 LMT.
- Distribution: Managed under the National Food Security Act, 2013 (NFSA) and other welfare schemes, including Pradhan Mantri Garib Kalyan Anna Yojana.
- The One Nation One Ration Card (ONORC) system allows migrant beneficiaries to access rations nationwide.
- Procurement: As of May 2024, 263.33 LMT of wheat and 489.20 LMT of rice have been procured, benefiting over 1 crore farmers.
- Financial Implications:
- The economic cost of procuring and distributing food grains has risen due to increased MSPs and related costs.
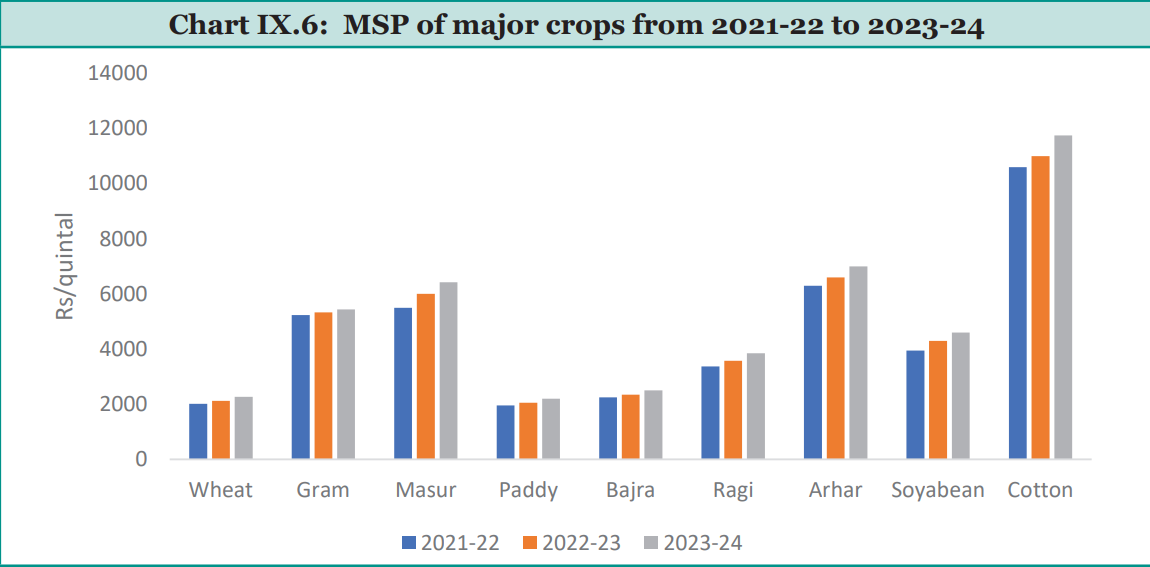
10 - Industry: Small & Medium Matters
Summary of Indian Economy in FY24
- Strong Economic Growth: In FY24, the Economy grew with a satisfying rate of 8.2%, which was supported by an industrial growth of 9.5%.
- Among the four sub-sectors of industry, manufacturing and construction achieved close to double-digit growth, while mining & quarrying and electricity & water supply also recorded strong positive growth in FY24.
- This reflects the broad-based acceleration of industrial output.
- HSBC India Purchasing Managers' Index (PMI) for manufacturing consistently stayed above 50, indicating sustained expansion and stability.
- Among the four sub-sectors of industry, manufacturing and construction achieved close to double-digit growth, while mining & quarrying and electricity & water supply also recorded strong positive growth in FY24.
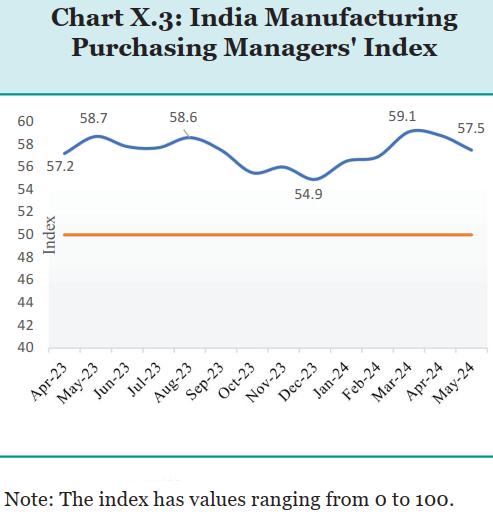
- Significance of Manufacturing Sector: The share of manufacturing in total gross value added at current prices was 14.3% in FY23.
- Backward & Forward Linkages: The output share is 35.2% during the same period, which indicates that the sector has significant backward and forward linkages.
- High Inter-Industry Consumption: Almost half (47.5%) of all output is used for further production in other sectors.
- Key Input Provider: Manufacturing supplies nearly 50% of the inputs used across all sectors (agriculture, industry, and services).
How are Key Sectors Performing?
Key Industrial Intermediates
- Cement Industry:
- Industry Contribution: Cement industry contributes approximately 11% of the input cost to the construction sector in India.
- Post-De-licensing Growth: Significant progress in capacity and process technology since de-licensing in 1991.
- India is the second-largest cement producer in the world after China.
- Geographical Distribution: Most plants are located near raw material sources.
- 85% of the industry is concentrated in Rajasthan, Andhra Pradesh, Telangana, Karnataka, Madhya Pradesh, Gujarat, Tamil Nadu, Maharashtra, Uttar Pradesh, Chhattisgarh, and West Bengal.
- Domestic Capacity and Imports: Cement imports in FY23 were about 0.2% of total domestic production.
- The export of clinker and other cement increased until FY19 and then started declining except for other hydraulic cement on account of lower global demand and increasing competition from other countries.
- In FY23, India exported only a negligible quantity of clinker.
- Sustainability Efforts: Cement sector generates about 7% of global anthropogenic emissions.
- Indian industry reduced greenhouse gas emissions to 0.56 t CO2 per tonne of cement in 2023.
- Target to reduce emissions to 0.35 t CO2 per tonne by 2050 as per the industry technology roadmap.
- Steel Industry:
- Sector Contribution:
- Iron and steel contribute approximately 47% of all inputs in the building and construction sector.
- Critical input for the production of machinery and consumer goods.
- Production and Consumption:
- Steel sector achieved the highest levels of production and consumption during FY24.
- Trade Balance:
- India became a net exporter of finished steel over the past decade.
- In FY24, India was a net exporter in Q1 but became a net importer in Q2 and Q3.
- This shift was driven by price differentials between international and domestic steel prices.
- Low international prices reduced export profit margins and made imports more affordable.
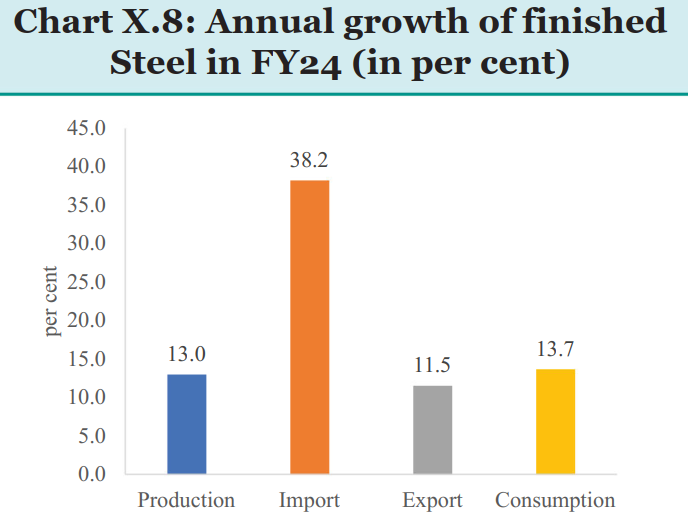
- Raw Material Dependence:
- Import dependence on coking coal increased from 56.1 MT in FY23 to 58.1 MT in FY24.
- Green Steel and Emissions:
- Green steel is expected to play a pivotal role in the future of the steel industry as the world moves towards a low-carbon economy.
- India’s steel sector accounts for 12% of the country's greenhouse gas emissions.
- Emission intensity of 2.5 tonnes of CO2 per tonne of crude steel, compared to the global average of 1.9 tonnes of CO2 per tonne.
- Initiatives for the Steel Sector:
- Nagarnar Steel Plant: Established in Oct 2023, this greenfield project aims to:
- Produce high-quality steel.
- Boost socio-economic development in the region.
- Make India a key player in the global steel market.
- Produce a range of flat steel products.
- Achieved 4.93 Lakh tonnes of hot-rolled coils in FY24.
- Steel CPSE Performance: Steel Authority of India Limited (SAIL) achieved its highest ever production of Hot metal, Crude steel and Saleable steel in FY24
- PLI Scheme for Speciality Steel: Launched in 2021, it has attracted investment of Rs 15,519 Crore till May 2024.
- Expected total investment: Rs 29,531 Crore
- Expected capacity addition: 24,780 thousand tonnes
- MOU signed with 27 companies (from 57 applications) on Mar 17, 2023.
- Nagarnar Steel Plant: Established in Oct 2023, this greenfield project aims to:
- Sector Contribution:
- Coal Sector:
- Dominant Energy Source: Coal makes up over 55% of India's primary commercial energy.
- Power Generation: 70% of India's total power comes from coal-fired plants.
- Production Increase: Coal production has been rising in the past five years.
- Reduced Reliance on Imports: This production increase has led to a decrease in India's dependence on imported coal.
- Domestic Production vs. Consumption: The ratio of domestic coal production to consumption has been improving steadily over the last decade. This means production growth is outpacing consumption growth.
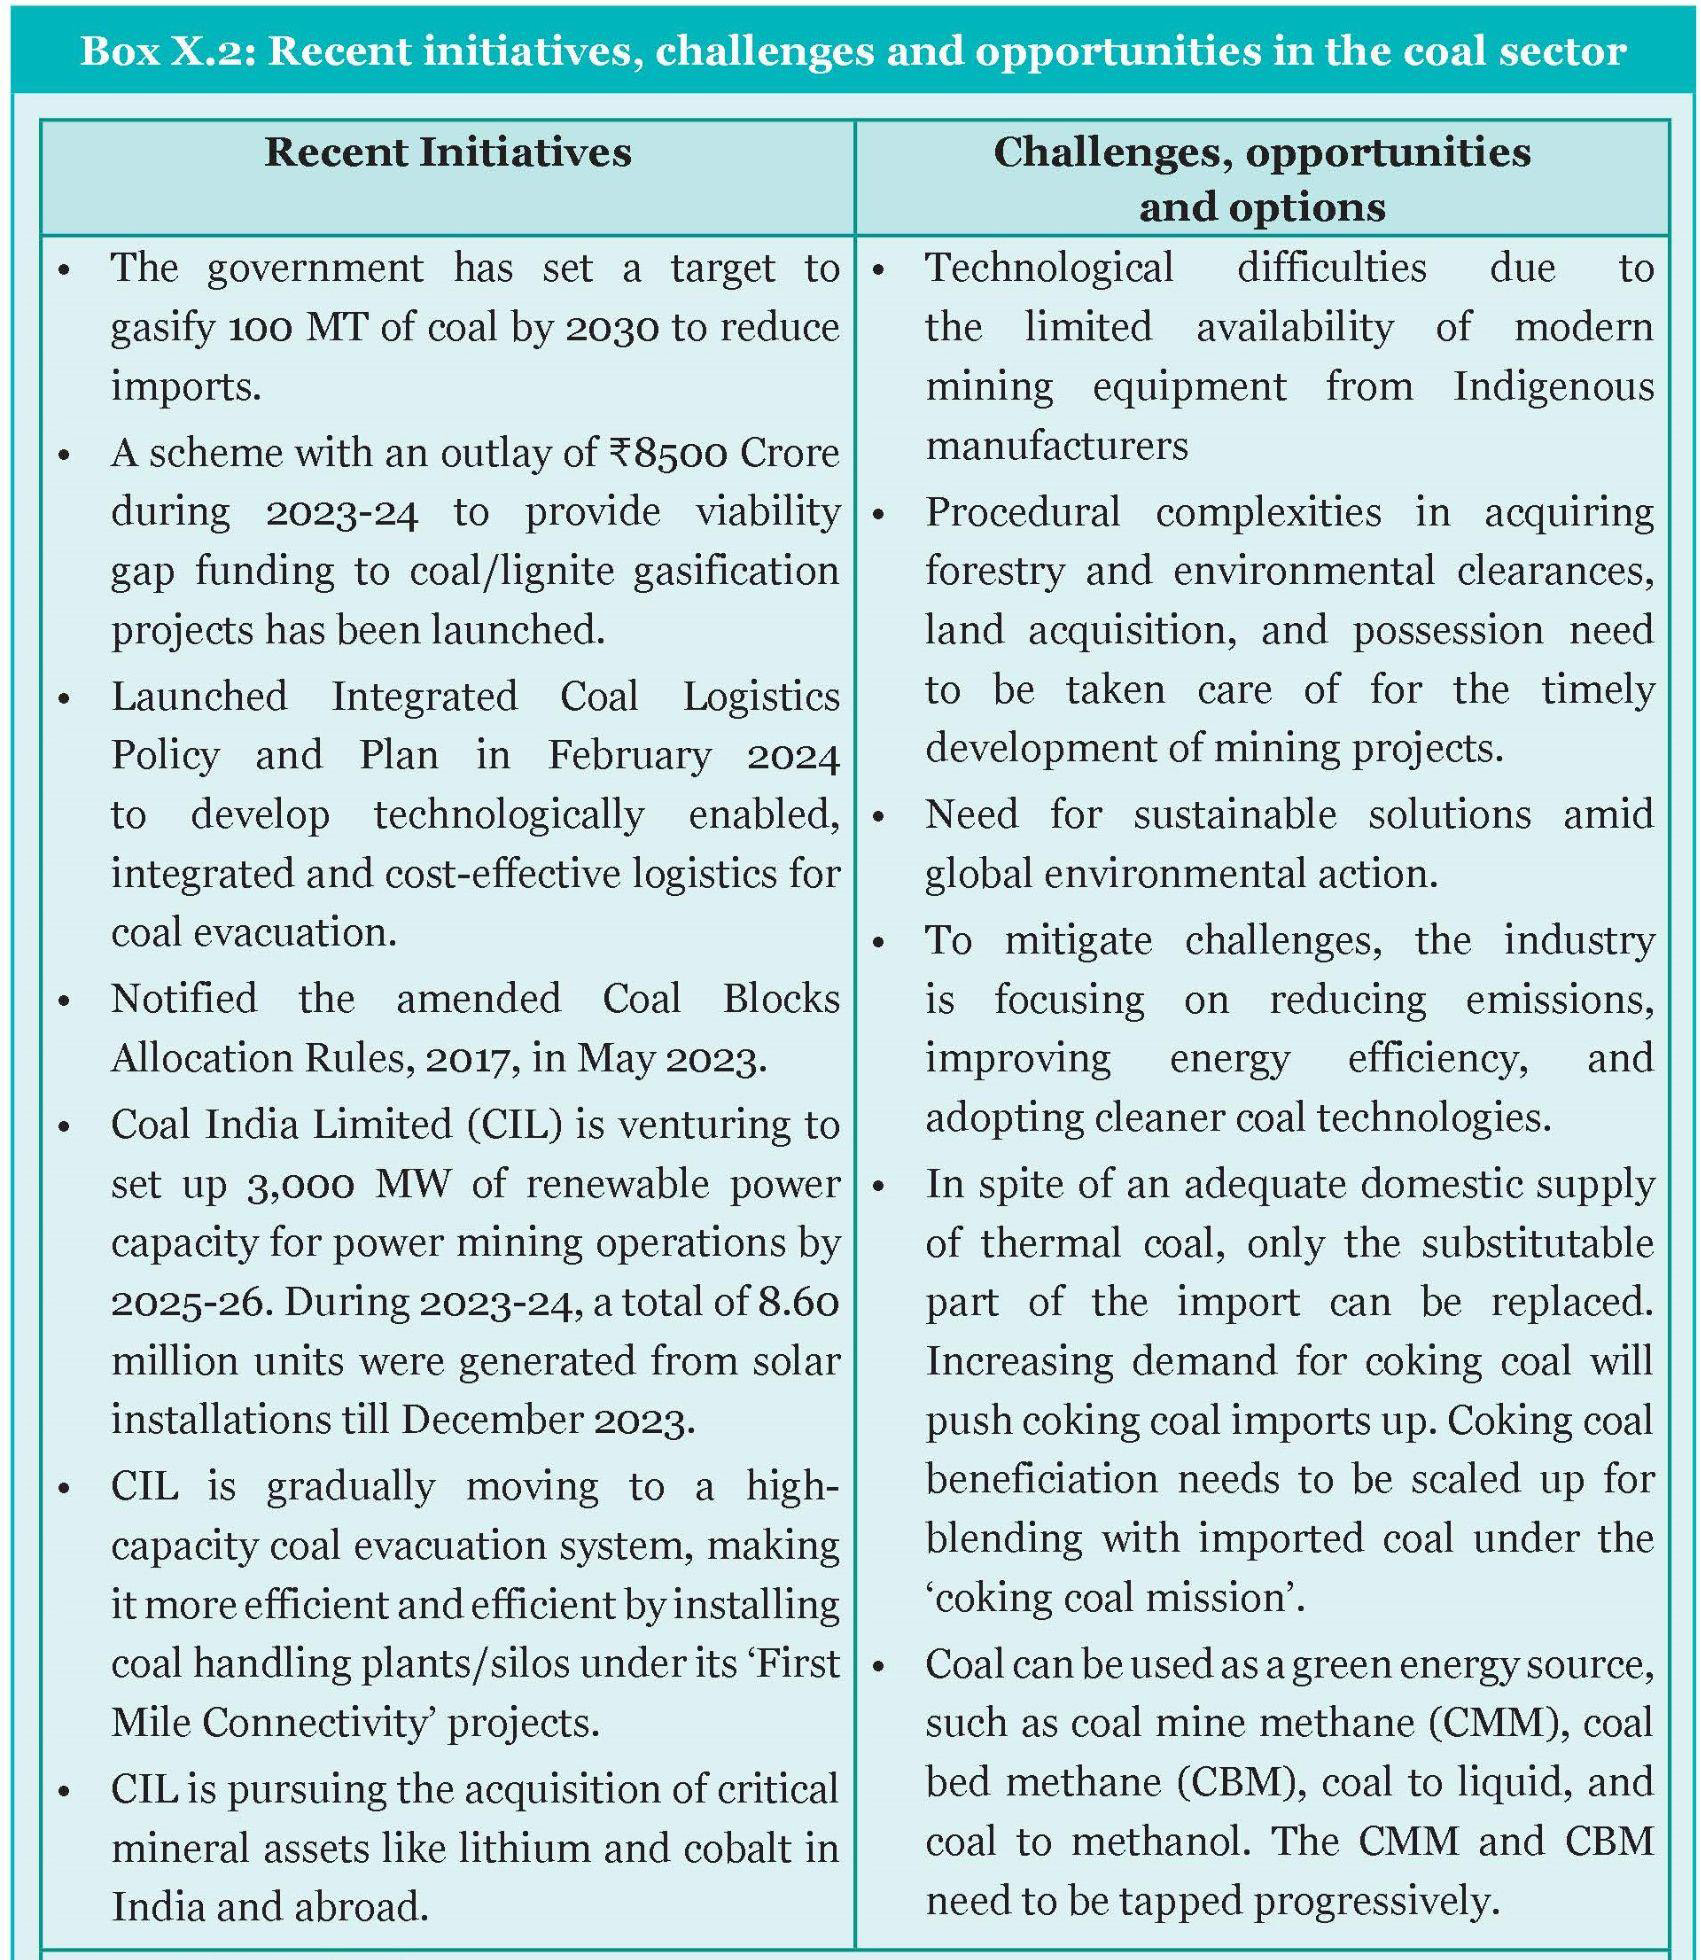
Major Consumer-oriented Industries
- Pharmaceuticals: Growing and Global Presence:
- Market Size and Rank: USD 50 Billion (world's third largest by volume)
- Product Base and Global Presence: Diversified product base covering a wide range of pharmaceuticals, including generic drugs, active pharmaceutical ingredients, bulk drugs, and more.
- Exports: Often referred to as the "Pharmacy of the world," India exports around 20% of the world's generic drugs by volume. It is home to eight of the top 20 global generic drug companies.
- Regulatory Framework Update: The government is continuously strengthening the regulatory framework. Revised pharma manufacturing rules were notified in December 2023 to ensure quality and adherence to global standards.
Why is there a Need to Enhance and Reimagine Pharma R&D?
|
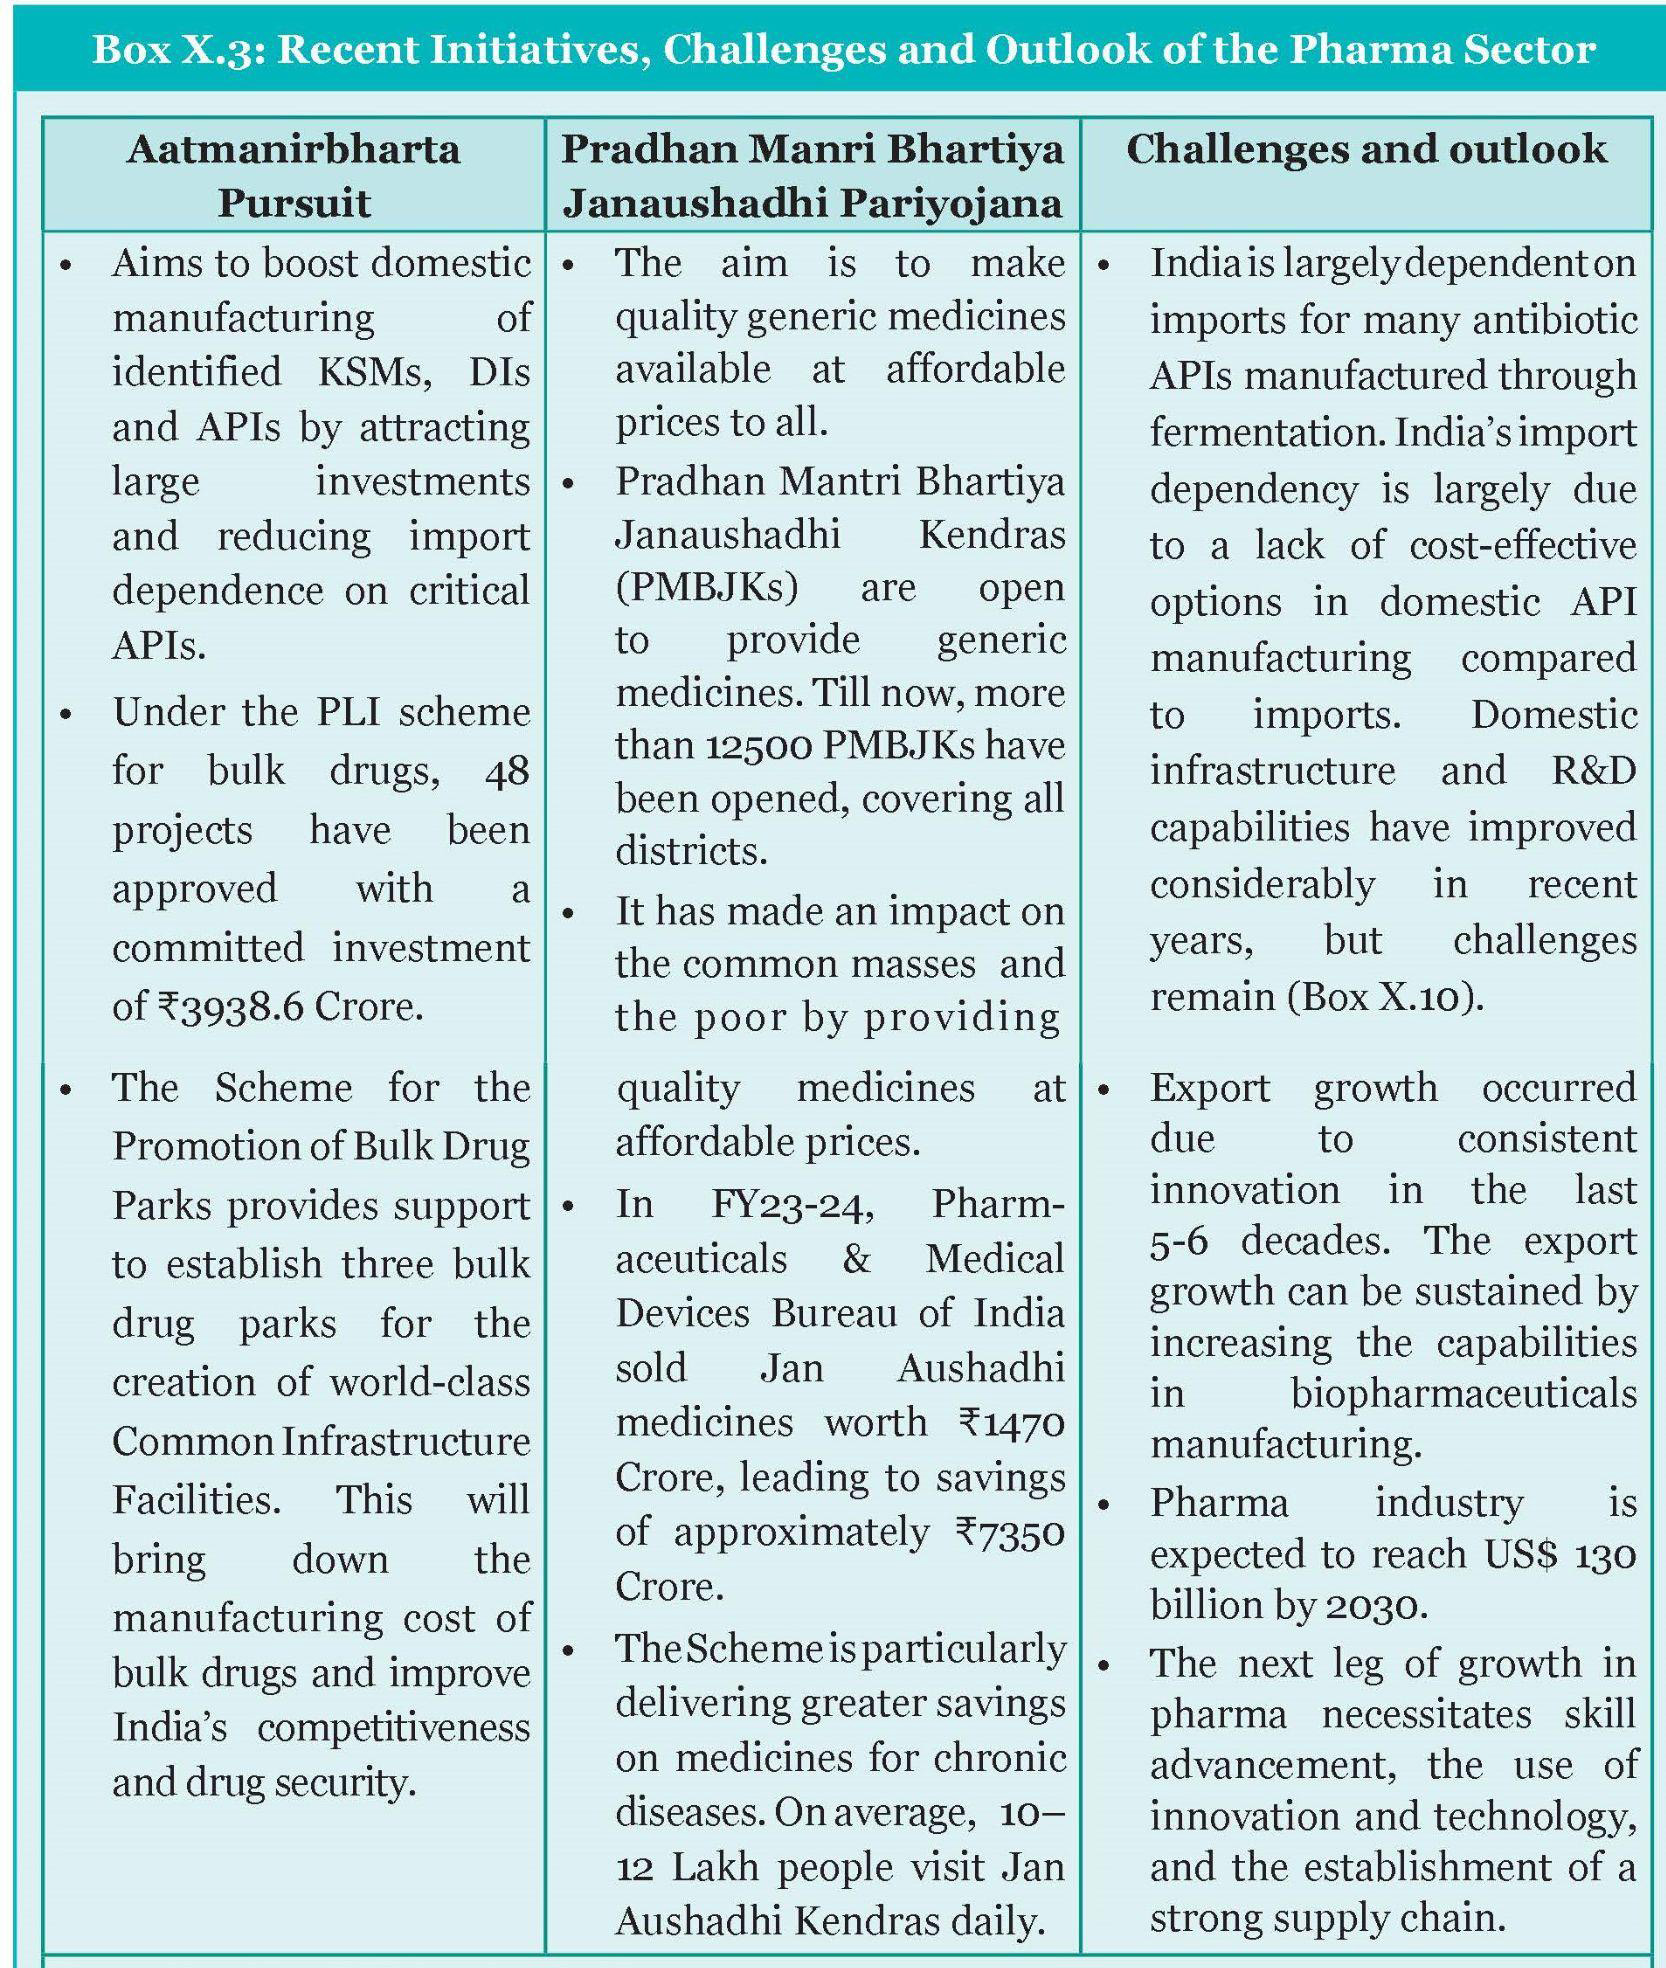
- Textile Industry: Navigating Challenges:
- Industry Size and Contribution
- Contributes 10.6% to the manufacturing GVA (Rs 3.77 lakh crore in FY23)
- Major player in the non-corporate sector (29.3% share)
- Strong corporate presence (7.9% share)
- Value Chain and Global Position
- Robust end-to-end value chain: natural and MMF fibre to finished products (apparel, home textiles, technical textiles)
- World's second-largest clothing manufacturer
- Top five textile and apparel exporters globally
- Export Performance (FY24)
- Grew by 1% to Rs 2.97 lakh crore
- Readymade garments dominated exports (41%)
- Followed by cotton textiles (34%) and man-made textiles (14%)
- Industry Size and Contribution
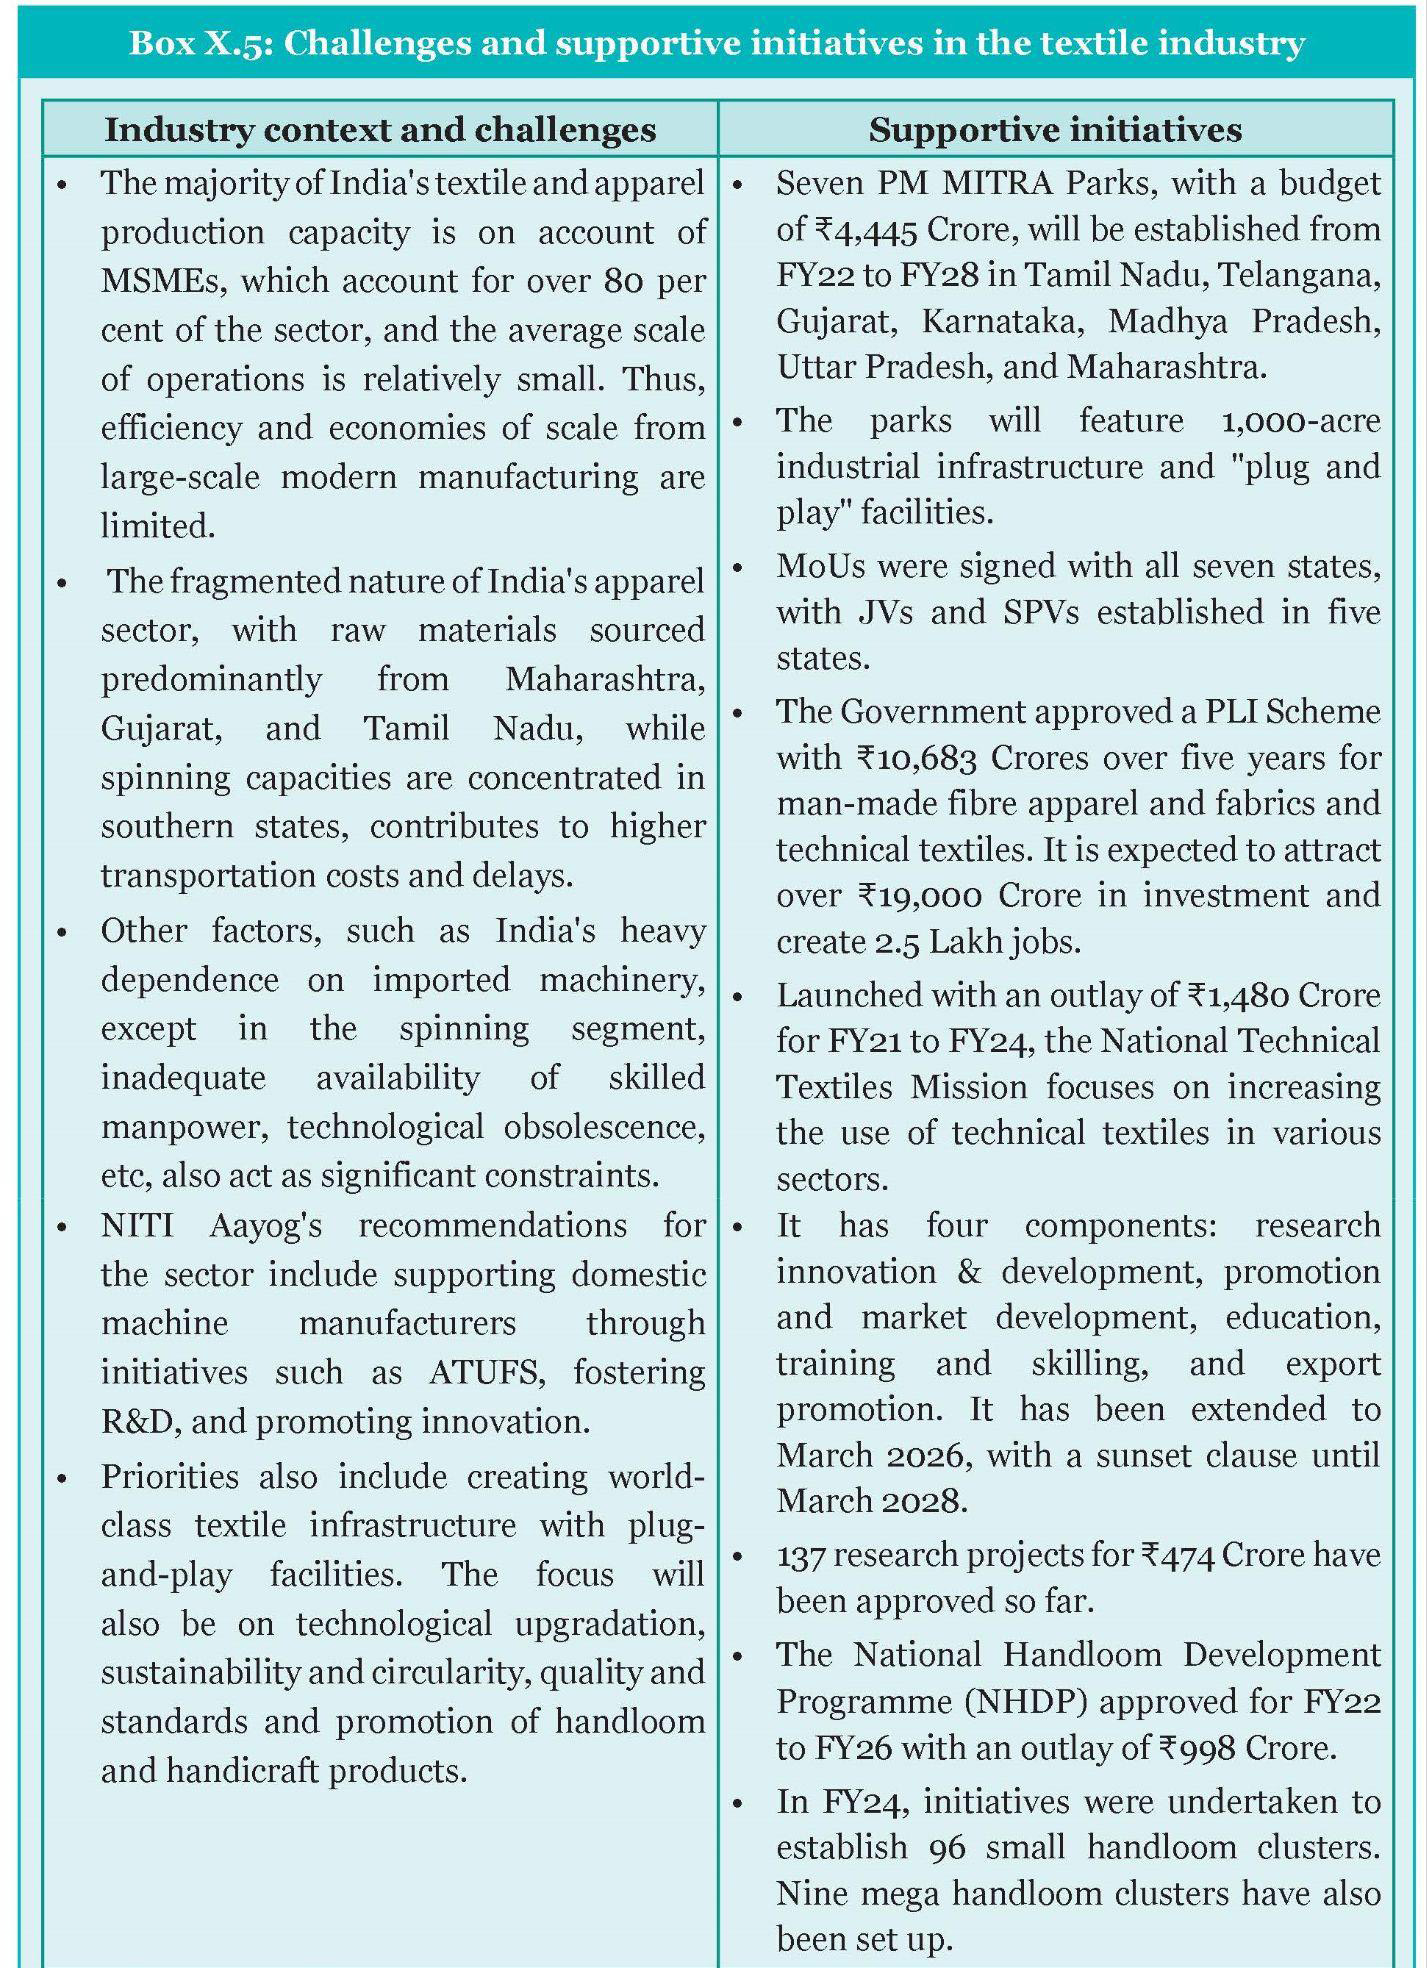
- Electronics Industry: Powering the Future:
- Domestic Value Addition (DVA): The share of DVA in mobile phone output increased from an average of 8.7% in FY17-FY19 to 22% in FY20-FY22, showing substantial local participation growth.
- Global Value Chains (GVC): Although DVA as a ratio of exports is low, participation in GVCs boosts overall value added due to economies of scale in global manufacturing.
- Employment: The direct workforce in mobile phone production more than tripled between FY17 and FY22, with significant benefits for female blue-collar workers.
- Wages and Salaries: There was a 317% increase in wages and salaries between Phase 1 (FY17-FY19) and Phase 2 (FY20-FY22).
- Initiatives to Boost the Electronics Industry:
- Production Linked Incentive (PLI) Scheme:
- For Large Scale Electronics Manufacturing: This scheme is designed to attract large-scale electronics manufacturers by providing financial incentives based on production.
- For IT Hardware: This scheme extends incentives to the IT hardware sector, promoting the manufacturing of products such as laptops, tablets, all-in-one PCs, and servers.
- Scheme for Promotion of Manufacturing of Electronic Components and Semiconductors (SPECS): Introduced in 2020, SPECS offers a substantial financial incentive of 25% on capital expenditure for a specific list of electronic goods that form the downstream value chain of electronic products.
- As of March 2024, a proposed investment of Rs 12,638 Crore and committed incentives of Rs 1758 Crore have been approved under this scheme.
- Modified Electronics Manufacturing Clusters (EMC 2.0): This scheme aims to create world-class infrastructure for attracting investments in the electronics systems design and manufacturing (ESDM) sector.
- Production Linked Incentive (PLI) Scheme:
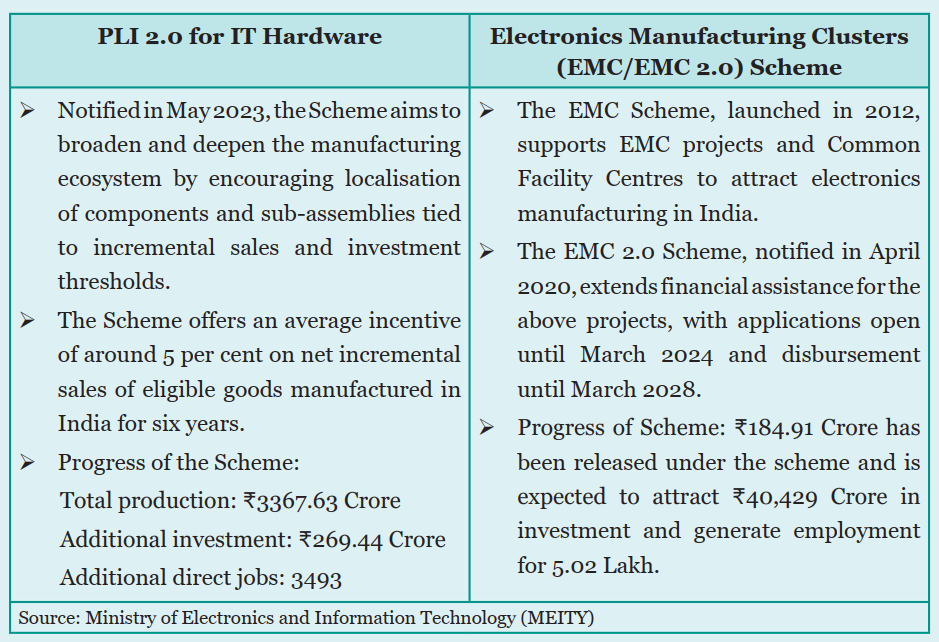
- Automotive Industry:
- Growth: Slower growth in domestic production and consumption of auto parts compared to the past five years. Auto component production depends on domestic and export markets.
- Impact of Pandemic: Pandemic weakened demand for auto parts due to a decline in the automobile sector.
- Segment-wise Performance:
- Passenger vehicles (cars & SUVs) - Strong growth pre-pandemic, quick recovery post-pandemic.
- Two-wheelers, Three-wheelers, Commercial Vehicles - Slower recovery post-pandemic compared to passenger vehicles.
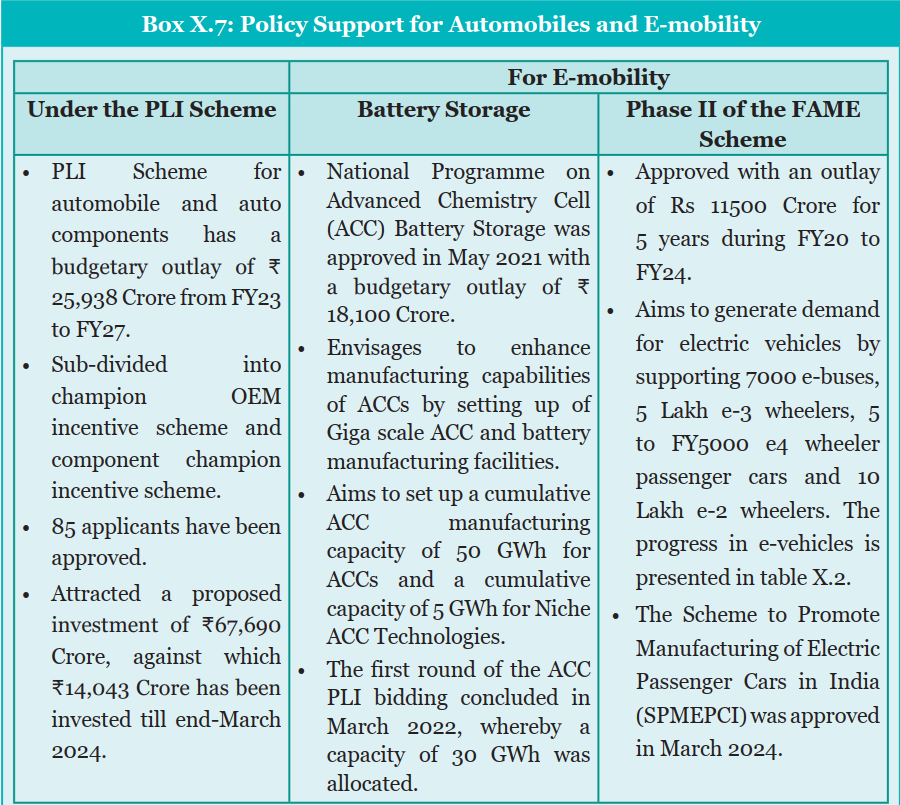
Micro, Small & Medium Enterprises
- Share of MSMEs in Manufacturing Output (FY22): 35.4% of all-India manufacturing output was contributed by MSMEs.
- Export Share of MSME-specified Products (2023-24): 45.7% of all-India exports were MSME-specified products.
- Unincorporated Enterprises Growth (Oct 2022 - Sep 2023): Increased by 5.9% compared to April 2021 - March 2022.
- Gross Value Added (GVA) per Worker: Increased from Rs 1,38,207 to Rs 1,41,769 during the same period.
- Gross Value of Output (GVO) per Establishment: Increased from Rs 3,98,304 to Rs 4,63,389 during the same period.
- Udyam Registration Portal:
- Launched in July 2020 to formalise MSMEs.
- As of 05 July 2024, 4.69 crore MSMEs registered.
- Includes informal micro enterprises registered on Udyam Assist Platform.
- Facilitates benefits from Ministry of MSME schemes.
- Enables priority sector lending from banks.
- API linkage with 37 other portals for data sharing.
- Union Budget 2023-24 Allocation:
- Rs 9,000 crore allocated to Credit Guarantee Fund Trust for Micro and Small Enterprises (CGTMSE).
- Aims to enable an additional Rs 2 lakh crore in credit with reduced costs.
- Significant growth in guarantees for micro and small enterprises from FY20 to FY24.
- Challenges and Opportunities: MSMEs face challenges, including issues with formalisation and inclusion, limited access to finance, markets, technology, and digitalisation, infrastructural bottlenecks, and skilling.
- To address these challenges, the Government has implemented initiatives and platforms aimed at supporting formalisation, ease of registration and grievance redressal, like the Samadhaan Portal, Sambandh Portal, and Champions Portal, which aid in delayed payment issues, procurement monitoring, and speedy resolution of grievances.
- The Global Value Chain Development Report (2019) highlights that although SMEs are underrepresented in global value chains, the digital economy offers them significant new opportunities.
- This is evident in India's MSME sector, where nearly 70% of total e-commerce sales in 2020-21 were from MSMEs, reflecting a year-on-year growth rate of 60- 70%.
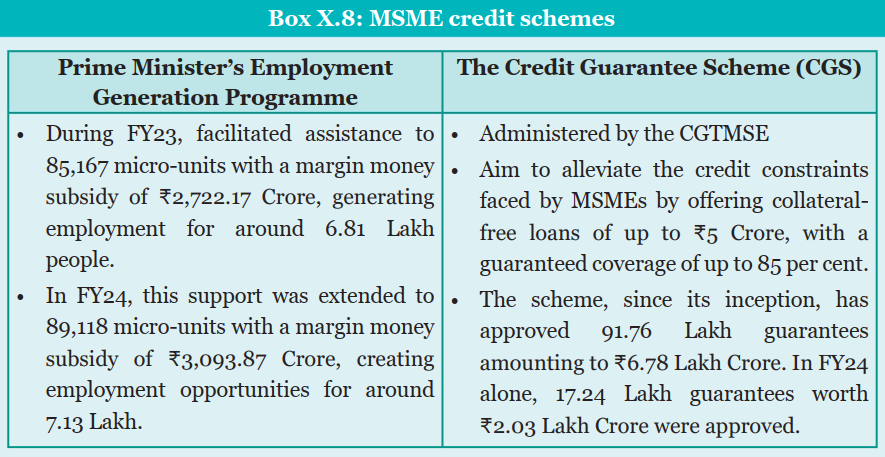
ODOP: Crafting Regional Pride and Economic Empowerment
- Launched: 2018
- Goal: Bridge regional economic divide and promote self-reliance across districts.
- Concept: Identify, brand, and promote one unique product from each district.
- Products Covered: Agriculture, manufacturing, handlooms, textiles, handicrafts, food processing, marine, and services.
- Progress till now:
- 1102 products identified from 761 districts.
- "PM-Ekta Malls" planned to promote ODOPs, GI products and handicrafts in state capitals/major cities.
- Initiatives to support ODOP:
- "ODOP Sampark" workshops for collaboration and reviving indigenous industries.
- Showcasing ODOPs at G20 events during India's presidency.
- Success Stories:
- Increased production of Shopian apples (Kashmir), red rice (Uttarakhand), Araku Valley coffee (Andhra Pradesh), Kandhamal turmeric (Odisha), and Bhatinda honey (Punjab) through various government initiatives.
Industrial R&D and Innovation
- Limited Public Sector Presence: Public sector has a limited role (around 7%) in core manufacturing in India.
- Impact on R&D: This limited role translates to a low share of public sector contribution to industrial R&D.
- Global Comparison: The US, China, and Germany lead in corporate R&D spending (according to Global Innovation Index 2023).
- Growth in Middle-Income Countries: India, Turkey, Brazil, and Indonesia have seen an increase in R&D spending.
- Concentration in R&D: India's industrial R&D is heavily focused on a few sectors (over 70% in top 5).
- Importance of Holistic Ecosystem: Building a well-rounded innovation ecosystem is critical for a sustainable, inclusive, and innovation-driven economy.
- Focus on All Stakeholders: The ecosystem should consider interactions between all stakeholders and institutions impacting innovation.
- Informal Innovation: Informal and grassroots innovation should be included due to their potential to address specific needs.
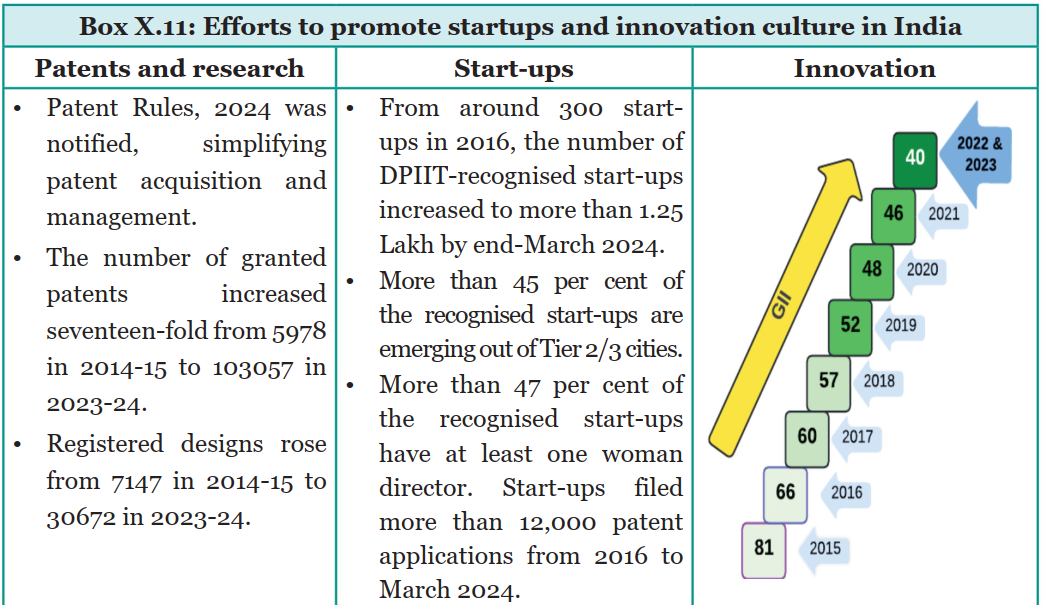
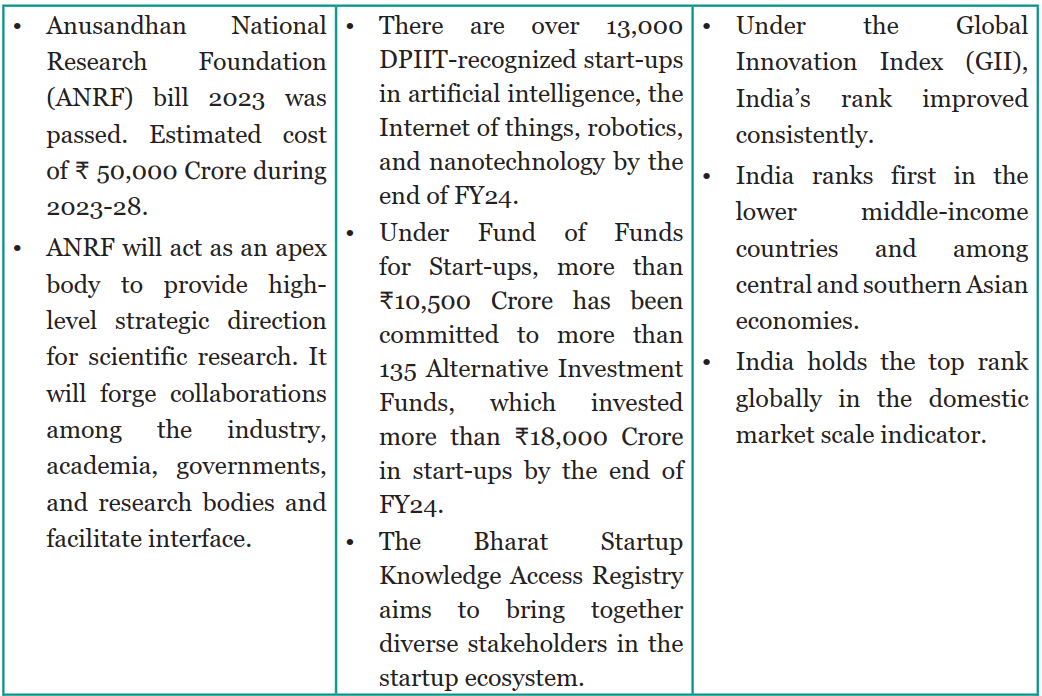
11- Services: Fuelling Growth Opportunities
India's services sector encompasses a wide array of economic activities, which can be broadly classified into two categories: contact-intensive and non-contact-intensive services. The former includes trade, hospitality, transport, real estate, social, community and personal services. The latter comprises financial, information technology, professional, communication, broadcasting, and storage services. The sector also incorporates public administration and defence services.
Key Factors Affecting the Performance of the Indian Services Sector
- Demand side factors:
- Large and young population driving demand for education, healthcare, finance, tourism, hospitality, and entertainment services.
- Rapid urbanisation supporting transportation, housing, sanitation, and utility services.
- E-commerce growth creates demand for logistics, digital payments, and related services.
- Supply side factors:
- Information technology (IT) and business services with a prominent international presence.
- Government initiatives like Digital India, export promotion schemes, infrastructure development, skill development, focus on healthcare and tourism.
- Challenges and Future Outlook:
- Potential impact of Artificial Intelligence (AI) on business services: Studies suggest that AI may restrain growth opportunities and challenge long-term sustainability and job creation in business services.
- Need for focus on human capital development: To address the challenge of AI and ensure long-term growth, focus on human capital development is crucial, especially to take advantage of the agglomeration effects of large, well-functioning cities.
Government Initiatives Supporting the Services Sector:
The Indian government has played a significant role in fostering the growth of the services sector through various initiatives, including:
- Digital India campaign to promote digital services
- Export promotion schemes to encourage services exports
- Infrastructure development to boost logistics, tourism, and hospitality sectors
- Skill development initiatives to enhance workforce capabilities
- Targeted efforts in healthcare and tourism to improve accessibility and development
Overview of the Services Sector Performance
Gross Value Added (GVA) in the services sector
- Summary of India's Services Sector Performance:
- Growth:
- Strong growth over the past decade, exceeding 6% real growth annually (except for pandemic year FY21).
- Services exports account for 4.4% of the global market (2022).
- Estimated growth of 7.6% in FY24 (Provisional Estimates).
- The services sector continues to command the highest share in the number of registered companies.
- In FY24 alone, 1,85,312 new companies were registered, out of which 71% were services sector companies.
- Supporting Indicators:
- Double-digit growth in both GST collections and e-way bills (wholesale & retail trade).
- Increased GST collection (Rs 20.18 lakh crore in FY24) indicates strong domestic trade.
- Challenges: Trade, hotel, and transport sectors haven't fully recovered to pre-pandemic levels.
- Positive Signs: Bank credit and deposits continue to grow (YoY March 2024), indicating strong financial services.
- Growth:
Purchasing Managers’ Index (PMI)- Services
|
Trade in the Services Sector
- Growth & Importance:
- Services exports have grown remarkably over the past 3 decades, surpassing merchandise exports and holding a significant share of global exports.
- In FY24, services exports accounted for 44% of India's total exports, ranking India 5th globally in services exports.
- Recent Performance (FY24):
- Growth slowed down to 4.8% due to a weakening global trade environment (compared to 27.8% growth in FY23).
- Key sectors:
- Computer & Business Services: 73% share, grew 9.6% YoY.
- Travel Services: Significant growth (24.6% YoY) due to post-pandemic tourism recovery.
- Transportation Services: Decline (19.1% YoY) due to decreased global freight rates.
- Growth in "other business services" driven by areas like consultancy, engineering, and advertising.
- India's growing popularity for Global Capability Centers (GCCs) has boosted software and business services exports.
- Pandemic accelerated a shift towards digitally delivered services, increasing India's share in this market (6% in 2023 vs 4.4% in 2019).
- Services Imports: Decreased by 2.1% YoY (FY24) due to lower global freight rates.
- Overall Impact: Rising services exports and falling imports improved India's net services receipts (FY24), helping to manage the current account deficit.
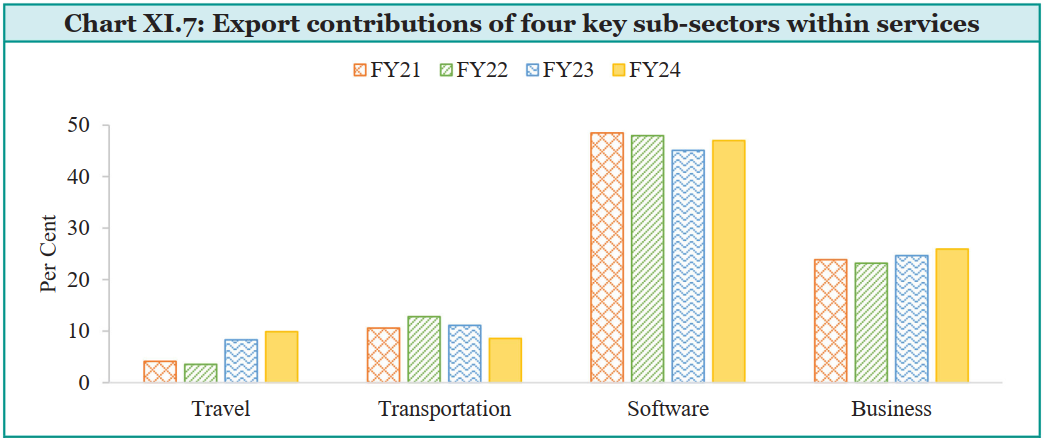
Financing Sources for Services Sector Activity
The services sector meets its financing needs through domestic credit from banks and capital markets, as well as international sources such as Foreign Direct Investment (FDI) and External Commercial Borrowings (ECBs).
- Bank Credit:
- FY24 saw a steady increase in credit inflow to the services sector.
- Year-over-year (YoY) growth rates surpassed 20% each month since April 2023.
- By March 2024, outstanding services sector credit was Rs 45.9 lakh crore.
- The YoY growth for the services sector credit was 22.9%.
- The aviation sector experienced the most significant YoY growth in credit inflow at 56%.
- This growth in aviation credit was due to increased aircraft leasing, hiring, and a positive medium to long-term growth outlook.
- External Financing:
- As per the World Investment Report (WIR) 2024 published by the United Nations Conference on Trade and Development (UNCTAD):
- India is ranked 15th in terms of Foreign Direct Investment (FDI) inflow among the top 20 host economies for the year 2023.
- India is the 2nd largest host country for international project finance deals.
- India ranks 4th in terms of Greenfield project announcements.
- FY24 saw a decline in FDI equity inflows to India's services sector, mirroring a decline in overall FDI equity inflows to India.
- Contributing factors to the decline include higher interest rates, geopolitical conflicts, global uncertainties, and rising protectionism favoring domestic sourcing.
- The services sector accounted for 53% of total external commercial borrowing (ECB) inflows in FY24.
- The services sector received USD 14.9 billion in inflows in FY24, registering a year-on-year growth of 58.3%, compared to 23.3% growth in FY23.
- As per the World Investment Report (WIR) 2024 published by the United Nations Conference on Trade and Development (UNCTAD):
Major Services: Sector-wise Performance
Physical Connectivity-based Services
Physical connectivity-based services facilitate the movement of goods, people, and information through transportation networks like trains, buses, taxis, airlines, and freight companies. Complementary services include vehicle maintenance and airport ground handling, while logistics services optimise supply chains.
- Roadways:
- Cargo Transport: A significant portion of India's cargo is moved via roadways.
- Toll Digitisation: Drastically reduced waiting times at toll plazas from 734 seconds in 2014 to 47 seconds in 2024.
- Future Tolling Efficiency: Initiatives like Automatic Number Plate Recognition and the Global Navigation Satellite System for free flow tolling.
- '4E' Strategy: The Ministry of Road Transport and Highways (MoRTH) has also devised a comprehensive '4E' strategy - Engineering (roads and vehicles), Enforcement, Emergency Care, and Education - to elevate road safety standards on NHs.
- Network Planning: Use of the PM Gati Shakti National MasterPlan portal for planning and congestion projections.
- Big Data Utilisation: Leveraging e-waybills and FASTag data to estimate transportation demand and improve logistics.
- High-Speed Corridors: Development of access-controlled high-speed corridors and expressways to reduce travel time and spur economic development.
- Challenges: Issues such as ribbon development along highways, slow digital land record onboarding, and long clearance cycles.
- Government Actions: Focus on developing access-controlled highways and upgrading existing ones, with emphasis on single-window clearances.
- Indian Railways:
- Indian Railways saw a 5.2% increase in passenger traffic (FY24) compared to the previous year.
- They carried 158.8 crore tonnes of freight (FY24), a 5.3% increase from the previous year (excluding Konkan Railway Corporation Limited).
- Freight loadings achieved a Compound Annual Growth Rate (CAGR) of 7.1% from FY20 to FY24.
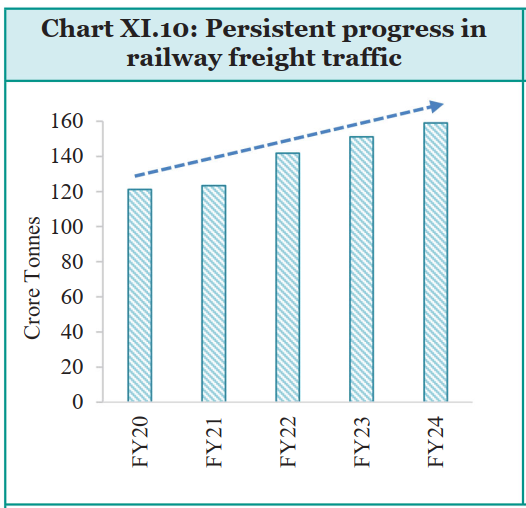
- Ports, Waterways and Shipping:
- Decentralisation and Integration: Increased decentralisation of decision-making and integration of professional expertise have improved port management.
- Public-Private Partnerships: Adoption of public-private partnership models has strengthened port effectiveness.
- Sagar Setu Application:
- Streamlines daily vessel and cargo operations.
- Integrated with 13 major ports, 22 non-major ports, and 28 private terminals in India.
- Aims to become a central hub for maritime engagements.
- River Cruise Tourism:
- Promoted on national waterways with infrastructure development benefiting both cargo and tourist vessels.
- 100% increase in overnight cruise trips during FY24.
- Lighthouse Development:
- Lighthouses are becoming significant tourist attractions.
- Development includes museums, amphitheatres, and cafeterias at 75 lighthouses to attract visitors.
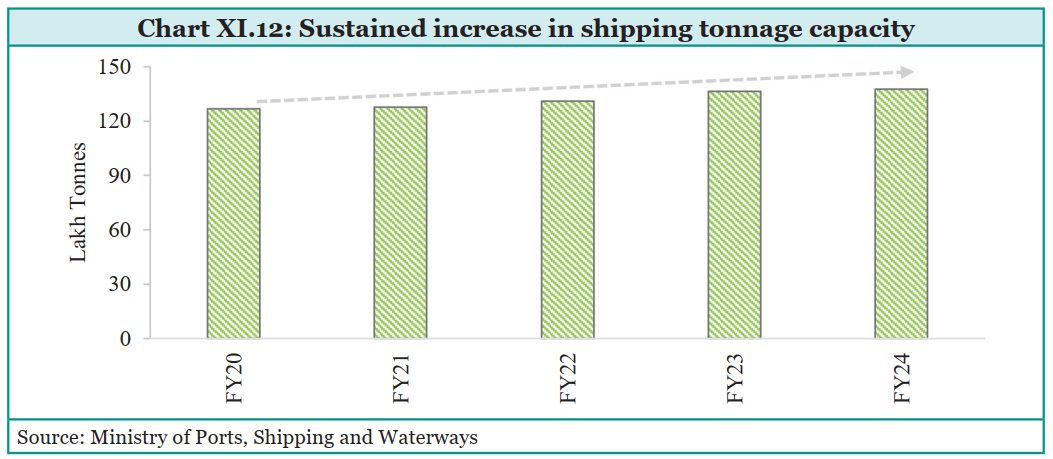
- Airways:
- Market Position: India is the third-largest domestic aviation market and one of the fastest-growing globally.
- Passenger Traffic:
- Total air passengers handled at Indian airports increased by 15% YoY.
- Domestic air passenger traffic rose by 13% YoY.
- International air passenger traffic grew by 22%.
- Air Cargo: Increased by 7% in FY24.
- Sector Potential:
- Driven by growing demand, economic activity, tourism, higher incomes, demographics, and aviation infrastructure.
- Government support includes approval of 21 greenfield airports and new terminal buildings.
- Regional Connectivity: 'UDAN' scheme has facilitated travel for over 141 lakh domestic passengers across 579 routes, connecting 85 underserved airports.
- Technology: Digi Yatra program benefits over 2.5 crore passengers and will be phased in at all airports.
- Future Prospects:
- Growth in Maintenance, Repair, and Operations (MRO) and drone industry.
- India aims to be a global drone hub by 2030 with liberalised regulations and incentives.
- Increased training organisations and aircraft leasing through the International Financial Services Centre (IFSC) at GIFT City.
- Tourism:
- Global Ranking: India is ranked 39th in the World Economic Forum's Travel and Tourism Development Index (TTDI) 2024.
- Tourist Arrivals: Over 92 lakh foreign tourist arrivals in 2023, a 43.5% YoY increase.
- Foreign Exchange Earnings: Tourism generated over Rs 2.3 lakh crore in 2023, a 65.7% YoY increase.
- Hospitality Industry:
- Increased average daily rate from Rs 6704 to Rs 7616 (13.6% YoY growth).
- Hotels are using technology for personalised experiences and operational efficiency.
- Innovative strategies include leasing or managing external brands for additional revenue.
- Government Initiatives:
- PRASHAD Scheme: 29 new tourism sites identified, 12 inaugurated.
- Swadesh Darshan 2.0: Targets 55 destinations across 32 states and Union Territories for integrated tourism development.
- Chaired the first Shanghai Cooperation Organisation (SCO) Tourism Expert Working Group.
- Digital Initiatives:
- E-Marketplace: Connects tourists with certified facilitators and guides via web and mobile apps.
- NIDHI Portal: Registers accommodation units to help develop tourism policies.
- SAATHI: Provides training to the hospitality industry on COVID regulations and safety measures.
- Real Estate:
- Economic Contribution: Real estate and ownership of dwellings account for over 7% of overall GVA, reflecting their significant economic role.
- Government Initiatives:
- PMAY-U: Over 1.2 crore houses sanctioned for urban beneficiaries.
- Policy Reforms: Goods and Services Tax, Real Estate (Regulation and Development) Act, Insolvency and Bankruptcy Code.
- Affordable Housing: Support from Affordable Housing Fund and SWAMIH Investment Fund.
- Credit Linked Subsidy Scheme: Rs 49,460.1 crore released, benefiting over 21.1 lakh households.
- Urban Infrastructure Development Fund: Rs 10,000 crore initial corpus to improve urban infrastructure.
- Future Outlook:
- Urbanisation: By 2050, half of India's population is expected to be urban dwellers.
- Digitisation: Improved transparency and efficiency in land transactions.
- Construction Approvals: Single-window clearance system to streamline processes.
- Challenges:
- Stalled Projects: Approximately 4.1 lakh units worth Rs 4.1 lakh crore affected.
- Recommendations: Include RERA registration, state government rehabilitation packages, and financing options.
- Housing Loan Market:
- RMBS Platform: Introduced by NHB to attract long-term investment and address funding limitations.
- Sustainability and Technology: Focus on green construction practices, energy-efficient designs, smart homes, and data-driven insights.
How RERA is Reshaping Real Estate?The Real Estate (Regulation & Development) Act, 2016 (RERA), was enacted to bring about much-needed reform in India's real estate sector. The main objective of RERA is to encourage greater transparency, citizen-centricity, accountability, and financial discipline, thus empowering home buyers and boosting the economy. All States/ Union Territories (UTs) have notified rules under RERA except Nagaland, which is in the process of notifying the rules.
Key Measures and Outcomes of RERA Implementation:
|
Information Technology Services, Tech start-ups and Global Capability centres
- IT and computer-related services have become increasingly significant, with their share of GVA rising from 3.2% (FY13) to 5.9% (FY23).
- Achieved a real growth rate of 10.4% in FY21 despite the pandemic which was driven by:
- Pandemic-induced demand for technology solutions.
- Contribution to export earnings.
- Expansion of GCCs and tech startups.
Global Capability Centres
- Growth of GCCs:
- Increase: From over 1,000 centres in FY15 to more than 1,580 centres with over 2,740 units by FY23.
- Employment: Exceeded 16.6 lakh in FY23.
- Sector Focus: Software, internet, and BFSI sectors make up about 58% of GCC talent.
- Revenue Growth: Increased from USD 19.4 billion in FY15 to USD 46 billion in FY23, with a CAGR of 11.4%.
- Drivers of Growth:
- ER&D: Strategic partnerships, digitalisation, and cloud technologies.
- IT Services: Increased demand for application modernisation, cloud migration, platform development, and cybersecurity.
- BPM: Transition to intelligent operations and data-driven solutions.
- Talent Gap:
- Demand: High demand for IT, data science, and cybersecurity roles globally.
- Shortage: 76% of IT employers reported difficulty finding skilled talent for Q3 2024.
- Specialisations: Blockchain, AI, Machine Learning, IoT, Cybersecurity, Cloud Computing, Big Data Analytics, AR, VR, 3D Printing, Web and Mobile Development.
- Initiatives to Bridge Talent Gap:
- Future Skills PRIME: A joint initiative by MeitY and NASSCOM for upskilling and reskilling IT professionals.
- Digital Skilling Program: Aims to skill, reskill, and upskill one crore students in emerging technologies.
- PMKVY 4.0: Focuses on skill development in Industry 4.0, AI, robotics, IoT, and drones.
Technology start-ups in India
Growth and Trends in Technology Start-Ups
- Growth and Current Status:
- Significant growth: 2,000 startups in 2014 to 31,000 in 2023 (NASSCOM data).
- 1,000 new startups established in 2023 alone.
- Ranks 3rd globally (NASSCOM).
- Strengths: Large pool of startups, unicorns, and scalability.
- 16% of global AI talent positions India as an innovation hub.
- Significant growth: 2,000 startups in 2014 to 31,000 in 2023 (NASSCOM data).
- Top Sectors for Start-Ups in 2023:
- EdTech: 16%
- EnterpriseTech: 12%
- BFSI: 10%
- Advertising and Marketing: 7%
- RetailTech: 6%
- Media and Entertainment: 5%
- ConsumerTech: 5%
- Professional Services: 4%
- Gaming: 4%
- Factors Driving Start-Up Growth:
- Changes in Consumption Patterns: Increased internet penetration spurred retail tech start-ups.
- BFSI Sector Surge: The introduction of UPI and other innovations since 2016.
- Cloud Solutions Demand: Growth in SaaS start-ups, including 21 unicorns since 2014.
- Pandemic Impact: Accelerated growth in HealthTech and EdTech due to the need for tele-consulting and remote learning.
Government Initiatives and Support
- Start-Up India Initiative:
- Support: Connects Indian start-ups with global ecosystems and engages in bilateral and multilateral forums for knowledge exchange and cross-border programs.
- Deep Tech Ecosystem:
- Recognition: Over 1.25 lakh DPIIT-recognized start-ups, including 13,000 in AI, IoT, Robotics, and Nanotechnology.
- National Deep Tech Start-up Policy (NDTSP):
- Focus: Addresses barriers like funding, resources, and risks associated with deep tech.
- Measures: Includes funding mechanisms, awareness programs, centralized mission office, IP protection, and monitoring mechanisms.
- Capital Flow Support:
- Fund of Funds for Start-ups: Rs 10,000 crore corpus to support start-ups at various stages and reduce dependence on foreign capital.
- Start-up India Seed Fund Scheme: Launched in 2021 to provide financial assistance for proof of concept, prototype development, product trials, market-entry, and commercialization.
Telecommunications
- Teledensity and Wireless Connectivity
- Teledensity Increase: From 75.2% in March 2014 to 85.7% in March 2024.
- Wireless Connections: Number of wireless telephone connections reached 116.5 crore by the end of March 2024.
- Internet Subscribers: Jumped from 25.1 crore in March 2014 to 95.4 crore in March 2024, with 91.4 crore accessing the internet via wireless phones.
- Internet Density: Increased to 68.2% in March 2024.
- Data Cost and Usage: Significant decline in the cost of data, leading to improved average wireless data usage per subscriber.
- 5G and 6G Advancements
- 5G Launch: First launched in October 2022, making India one of the fastest-growing 5G networks globally.
- International Rank: Improved from 118 to 15 in mobile broadband speed by March 2024.
- 5G Test Bed: Provides end-to-end testing facilities for R&D teams in academia and industry.
- Bharat 5G Portal: Fosters innovation, collaboration, and knowledge-sharing in the telecom sector.
- 6G Initiatives:
- Bharat 6G Vision Document: Launched in March 2023 to develop and deploy 6G technologies.
- Bharat 6G Mission: Established to lay down phase-wise objectives and includes an Apex Council.
- Bharat 6G Alliance: Launched in July 2023, this platform facilitates collaboration among public and private entities, academia, and research institutions to position India as a leading global supplier of affordable 5G, 6G, and future telecom solutions.
- 5G Launch: First launched in October 2022, making India one of the fastest-growing 5G networks globally.
- BharatNet Program
- Objective: Provide broadband connectivity to all Gram Panchayats (GPs) in India.
- Achievements: As of 31 March 2024, 6,83,175 kilometers of Optical Fibre Cable (OFC) laid, connecting 2,06,709 GPs in phases I & II.
- Regulatory and Structural Reforms
- Spectrum Reforms: Includes spectrum sharing and trading, rationalized spectrum usage charges.
- FDI Policy: 100% foreign direct investment allowed under the automatic route, subject to safeguards.
- Telecommunications Act 2023: Consolidates laws relating to telecommunication services and networks, assignment of spectrum, etc.
- Funding and Skill Development
- R&D Funding: Allocation of 5% of annual collections from the Universal Services Obligation Fund (USOF) for telecom sector R&D.
- Telecom Technology Development Fund: Formulated in 2022, encourages participation from start-ups, MSMEs, academia, and industry.
- Educational Alignment: New courses in electronics and communications engineering aligned with industry needs. Skill courses related to 5G and 5G-enabled technology approved by National Council for Vocational Education and Training (NCVET).
- All India Council for Technical Education (AICTE) includes 5G as a focus area in faculty development programs.
- Consumer-Centric Initiatives
- Sanchar Saathi Portal: Launched in May 2023 to empower mobile subscribers, enhance security, and raise awareness.
- Chakshu Facility: Introduced in March 2024 for reporting suspected fraud communications, with appropriate actions taken based on complaints.
- Sanchar Saathi Portal: Launched in May 2023 to empower mobile subscribers, enhance security, and raise awareness.
E-Commerce
- Market Size and Modern Retail Penetration
- Projected Growth: Expected to cross USD 350 billion by 2030.
- Modern Retail Share: Currently largely unorganised, but the share of modern retail (including e-commerce) is projected to rise to 30-35% of the total retail market within the next 3 to 5 years.
- Key Drivers of E-commerce Growth
- Technological Advancements: Innovations in technology have facilitated the growth of e-commerce platforms.
- New-Age Business Models: The evolution of business models has significantly contributed to market expansion.
- Government Initiatives:
- Digital India Program: Promoting digital infrastructure and services.
- Unified Payments Interface (UPI): Streamlining digital transactions.
- One District - One Product (ODOP) Initiative: Encouraging district-level specialization and online marketing.
- Open Network for Digital Commerce (ONDC): Enhancing digital commerce reach.
- New Foreign Trade Policy: Facilitating ease of doing business.
- Relaxation in FDI Limits: Attracting foreign investments.
- Consumer Protection (E-Commerce) (Amendment) Rules 2021: Strengthening consumer rights.
- Advantages of E-commerce Over Traditional Retail
- Diverse Benefits: Offers a wide array of benefits to both sellers and consumers compared to brick-and-mortar markets, including convenience, broader product range, and competitive pricing.
- Challenges Facing E-commerce Growth
- Inadequate Skills: Many sellers lack necessary skills for online selling, such as cataloguing.
- Data Privacy and Online Fraud: These issues are significant hurdles, highlighting the need for user education on safe e-commerce practices.
- Regulatory Framework and Consumer Protection
- Consumer Protection (E-Commerce) Rules, 2020: Designed to protect consumers from unfair trade practices in e-commerce.
- Information Technology (Intermediary Guidelines and Digital Media Ethics Code) Rules, 2021: Ensures accountability of digital platforms.
- Digital Personal Data Protection Act, 2023: Provides a comprehensive framework for data protection, safeguarding consumer information.
ONDC- Democratising Digital CommerceOpen Network for Digital Commerce (ONDC) is a pioneering initiative of the Department for Promotion of Industry and Internal Trade, aimed to democratise digital commerce and enable small businesses to capitalise on the benefits of digital commerce by creating a level playing field. ONDC is helping small businesses in India in several ways:
|
Challenges & Opportunities
- Skills and Workforce Development
- Challenge: The rapid digitisation in the services sector necessitates a skilled workforce to keep pace with technological advancements. However, there is a gap in the availability of workers with relevant digital and high-tech skills.
- Opportunity: Government initiatives like Skill India and the National Education Policy focus on equipping the workforce with necessary skills. Upskilling via these programs, in collaboration with industry, can position India as a high-value partner in areas such as:
- Cybersecurity
- Enterprise Management
- Financial Risk Management
- Insurance
- Infrastructure and Logistics
- Challenge: Infrastructure bottlenecks, high logistics costs, and complex regulatory compliances hinder economic activities.
- Opportunity: Several initiatives aim to address these issues, with a focus on:
- Enhanced Services: Leveraging India's extensive coastline and river network for improved port operations and inland waterways.
- Example: Kerala's Kochi Water Metro, benefiting 33,000 islanders, highlights the potential of inland waterways for tourism, commerce, and transportation.
- Global Benchmark: The Netherlands' dense network of inland waterways, covering approximately 6,000 kilometres and handling significant freight movement, showcases the potential benefits.
- Adoption Nationwide: Implementing similar strategies across India can enhance the inland water transport system, support sustainable growth, and ease congestion.
- Enhanced Services: Leveraging India's extensive coastline and river network for improved port operations and inland waterways.
- Access to Finance
- Challenge: Accessing finance can pose difficulties, particularly for small and medium enterprises (SMEs) in the services sector.
- Opportunity: Initiatives such as Mudra Yojana, Start-up India, and Stand-up India aim to ease credit accessibility. Further measures include:
- Streamlining Loan Processes: Making loan processes more efficient.
- Expanding Credit Guarantee Schemes: Increasing the reach of these schemes to provide more comprehensive support.
- Alternative Credit Appraisal Methods: Innovating new methods for credit evaluation.
- Supply Chain Financing: Developing innovative financing options.
- Project Documentation Support: Governments may establish agencies to assist with project documentation and improve project bankability.
- Regulatory Landscape
- Challenge: The regulatory landscape in the services sector has been complex. Opportunity: Positive transformations are underway with initiatives like:
- GST Simplification: Making tax processes more straightforward.
- Start-up India: Fostering a supportive environment for new businesses.
- Sector-Specific Policies: Such as the Real Estate (Regulation and Development) Act.
- Further Simplification: Enhancing procedural simplification through:
- Single-window systems
- Streamlined legal provisions
- Digitising government processes at all administrative levels
- Challenge: The regulatory landscape in the services sector has been complex. Opportunity: Positive transformations are underway with initiatives like:
- Data Privacy and Cybersecurity
- Challenge: Increasing digitisation of services raises critical concerns about data privacy and cybersecurity.
- Opportunity: The Government is spearheading data protection laws and cybersecurity policies to safeguard consumer data and strengthen cybersecurity measures. Key actions include:
- Adoption of Strong Security Measures: Ensuring robust security practices are in place.
- Compliance with Privacy Regulations: Adhering to data protection laws.
- Innovation in Security Technologies: Fostering advancements in security solutions.
Way Forward
- Leverage Technological Advancements: Continue investing in and adopting emerging technologies like blockchain, AI, machine learning, IoT, cybersecurity, cloud computing, big data analytics, augmented reality, virtual reality, 3D printing, and web/mobile development. This will not only enhance domestic service delivery but also keep India competitive in the global market.
- Focus on Skill Development: Implement robust skilling programs to ensure the workforce is adept in high-demand areas. Emphasize cognitive skills, digital literacy, and proficiency in the latest technologies to meet evolving job demands and mitigate potential slowdowns in services export growth due to AI advancements.
- Diversify and Strengthen Service Exports: Continue to expand the range of service exports beyond traditional software services to include HR, legal, and design services. This diversification aligns with global demand and helps in building a more resilient export sector.
- Boost the Tourism Sector: Given its potential for employment generation, the tourism sector should receive targeted policy attention. Collaborative efforts between government and private sectors are essential to unlock this potential and create sustainable job opportunities.
- Address Economic Uncertainties: Develop strategies to manage input costs and demand fluctuations caused by global economic uncertainties and commodity price volatility. Focus on sustaining positive demand trends and strengthening competitive positioning to navigate these challenges.
- Promote Innovation in Start-ups: Support and scale up technology start-ups that are driving innovation in manufacturing and other service sectors. Leveraging the deep technology ecosystem and ensuring access to credit and resources will be vital for their growth.
12 - Infrastructure: Lifting Potential Growth
Creation of resilient, world-class infrastructure—physical, social, financial and digital—is a key plank of India’s policy strategy to become ViksitBharat @ 2047. However, recent studies by the Asian Development Bank and the World Bank and recent estimates made by agencies like CRISIL have identified gaps in infrastructure investment in different sectors.
Infrastructure Financing: The Public Expenditure Push
Key Facts
- Central Role of Government Capital Expenditure: Despite recent financial innovations, capital expenditure by the Union and State Governments remains central to funding large-scale infrastructure projects.
- This highlights the continued reliance on traditional government spending for major infrastructure developments.
- Complexity in Infrastructure Financing:The emergence of various new funding instruments and strategies has made the infrastructure financing space complex. Additionally, differential definitions and patterns in maintaining statistics by different agencies make it challenging to aggregate the total flow of funds for infrastructure in any given year.
- The complexity and lack of uniformity in data make it difficult to assess the overall investment in infrastructure comprehensively.
Capital Expenditure Trends
- Increase in Capital Expenditure:
- Union Government: Capital expenditure increased by 2.2 times from FY21 to FY24 (Provisional Actuals).
- State Governments: Capital expenditure increased by 2.1 times during the same period.
- This substantial increase underscores the Government's strong emphasis on infrastructure development.
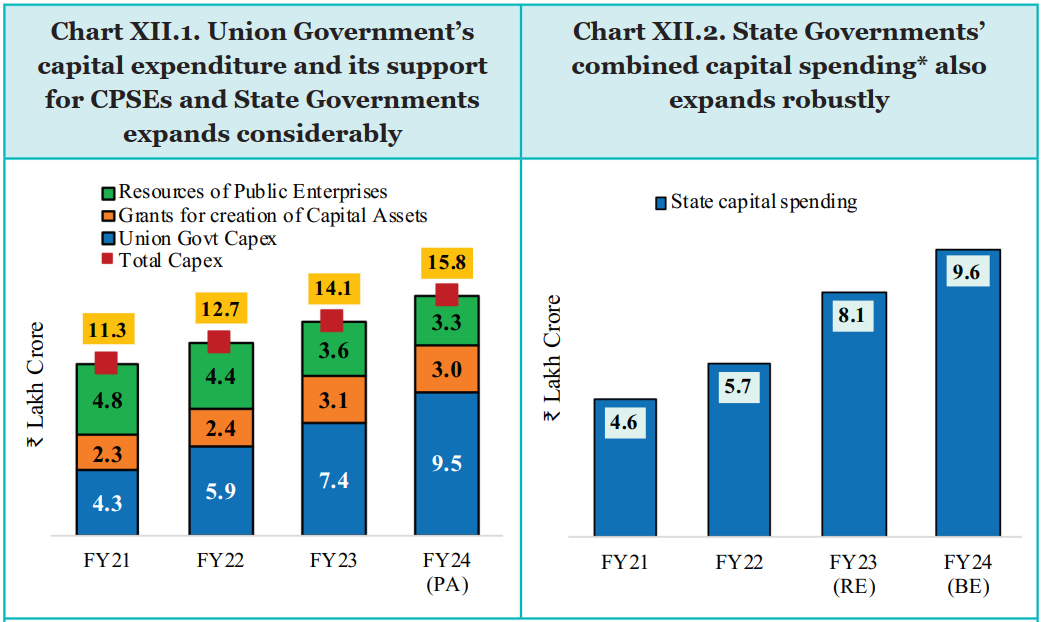
- Gross Budgetary Support (GBS):
- Components: Includes spending by line departments and GBS given to Central Public Sector Enterprises (CPSEs).
- Focus Areas: Share of GBS for Railways and the National Highway Authority of India (NHAI) increased from 36.4% in FY21 to 42.9% in FY24 (Revised Estimates).
- The expenditure for these two key segments increased by 2.6 times from FY21 to FY24 (Revised Estimates).
- The increased focus on railways and highways reflects a strategic emphasis on key connectivity infrastructure.
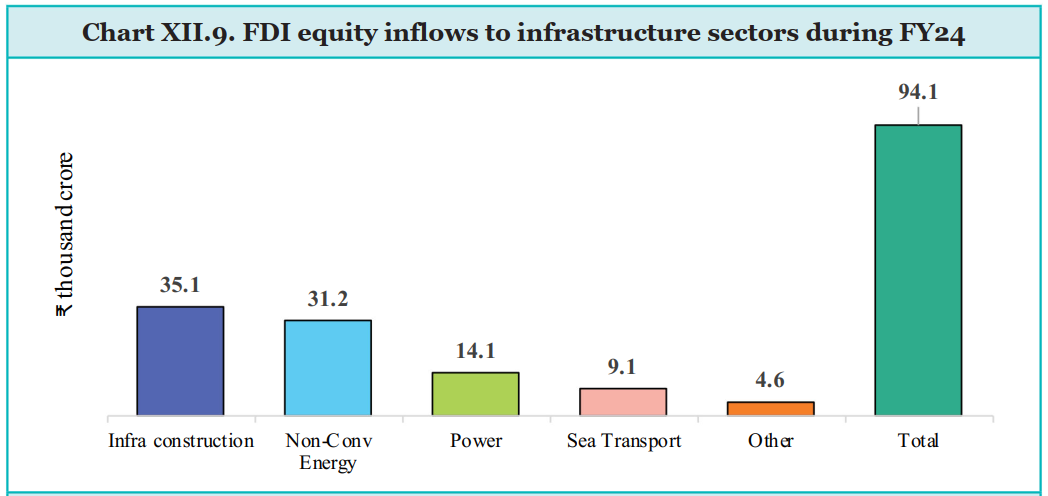
Major Mechanisms for fostering Public Private Partnership (PPP)
|
National Monetisation Pipeline (NMP)
- The National Monetisation Pipeline (NMP) was announced in August 2021 with the principle of 'asset creation through monetisation,' aiming to leverage private sector investment for new infrastructure development.
- The program outlines a monetisation potential of Rs 6.0 lakh crore through core government assets over four years, from FY22 to FY25. The pipeline includes more than 20 asset classes across 12 Ministries.
- Key Achievements
- Initial Success:
- In the first two years (2021-22 and 2022-23), transactions worth approximately Rs 2.3 lakh crore were completed under the core asset monetisation programme.
- Continued Progress:
- In 2023-24, transactions amounting to Rs 1.51 lakh crore were completed, representing a 55% increase from the Rs 97 crore achieved in 2021-22.
- Initial Success:
- Impact and Future Outlook
- Mobilising Private Investment: Tapping into private sector resources to fund new infrastructure projects.
- Optimising Asset Utilisation: Ensuring that government assets are utilised efficiently to generate maximum value.
- Accelerating Infrastructure Growth: Facilitating faster infrastructure development through private sector participation and investment.
Development across Infrastructure Sectors
This section discusses the progress in key infrastructure sectors along with outlook and challenges, including covering physical connectivity, electricity, water and sanitation, urban development, strategic and digital infrastructure.
Physical Connectivity Infrastructure
Road Transport:
- Capital Investment and Private Sector Involvement
- Capital Investment Increase: The combined capital investment by the Government and the private sector has risen from 0.4% of GDP in FY15 to approximately 1.0% of GDP (around Rs 3.01 lakh crore) in FY24.
- Private Investment Surge: FY24 saw the highest-ever private investment in the road sector, driven by a favorable policy environment.
- Asset Monetisation: Funds raised through asset monetisation in the roads sector have exceeded Rs 1 lakh crore since FY19. In FY24 alone, the Government achieved record asset monetisation revenues of Rs 40,314 crore.
- Development and Expansion of National Highways
- Highway Network Growth: The length of national highways has increased by 1.6 times from 2014 to 2024.
- Bharatmala Pariyojana Impact:
- High-speed corridors expanded by 12 times.
- Four-lane roads increased by 2.6 times between 2014 and 2024.
- Construction Efficiency:
- The average pace of national highway (NH) construction has improved nearly threefold, from 11.7 km per day in FY14 to approximately 34 km per day in FY24.
- Logistics Efficiency and Global Ranking
- Improved Logistics Performance: The enhanced NH network has significantly boosted logistics efficiency.
- India's ranking in the World Bank's Logistics Performance Index has improved consistently, moving from 54th in 2014 to 44th in 2018, and to 38th in 2023.
- Improved Logistics Performance: The enhanced NH network has significantly boosted logistics efficiency.
- Multi-Modal Logistics Parks (MMLP)
- Dedicated MMLPs: The Ministry of Road Transport & Highways (MoRT&H) has focused on developing Multi-Modal Logistics Parks to further enhance logistics efficiency.
- Achievements by FY24: Six MMLPs awarded, with Rs 2,505 crore allocated for these parks in FY24.
- Future Plans: Seven additional MMLPs are planned to be awarded in FY25.
- Dedicated MMLPs: The Ministry of Road Transport & Highways (MoRT&H) has focused on developing Multi-Modal Logistics Parks to further enhance logistics efficiency.
Key Initiatives for Road Development:
- Development of Rural Roads - Pradhan Mantri Gram Sadak Yojana (PMGSY)
- Key Phases and Milestones
- PMGSY-I (2000): Provide connectivity via all-weather roads, with necessary culverts and cross-drainage structures, to eligible unconnected habitations in rural areas.
- PMGSY-II (2013): Upgrade 50,000 km of selected through-routes and major rural links (MRLs) in various states and union territories.
- Strategically Important Roads (2016): Focus on road connectivity for strategically important roads in left-wing extremism-affected areas, introduced as a separate vertical under PMGSY.
- PMGSY-III (2019): Consolidate 125,000 km of through routes and MRLs, connecting habitations to key infrastructure such as gramin agricultural markets, higher secondary schools, and hospitals.
- Achievements
- Completed Road Length: As of 18th June 2024, 763,308 km of road length has been completed at an expenditure of Rs 3.23 lakh crore (including state share).
- Connectivity: 99.6% of the targeted habitations under PMGSY-I have been provided connectivity.
- Key Phases and Milestones
- Development of Industrial Corridors - National Industrial Corridor Programme
- The Government is developing 11 industrial corridor projects in a phased manner, aimed at enhancing multi-modal connectivity with resilient and sustainable infrastructure.
- Key Industrial Corridors
- Delhi-Mumbai Industrial Corridor (DMIC)
- Chennai-Bengaluru Industrial Corridor (CBIC)
- Amritsar Kolkata Industrial Corridor
- East Coast Economic Corridor (ECEC)
- Vizag-Chennai Industrial Corridor
- Bengaluru-Mumbai Industrial Corridor
- Infrastructure and Land Allocation
- Allotted Plots: As of March 2024, 308 plots (1,789 acres) have been allotted in four cities.
- Available Land:
- Industrial Land: 2,104 acres of developed industrial land are readily available for allotment.
- Commercial/Residential/Other Land Use: 2,250 acres available for various uses.
Key Initiatives Enhancing Road Connectivity
|
Railways:
- Network and Workforce: Indian Railways boasts a network of over 68,584 route kilometers as of 31st March 2024, and employs 12.54 lakh individuals as of 1st April 2024, making it the fourth largest network globally under a single management.
- Capital Expenditure and Infrastructure Development
- Increased Investment: Capital expenditure on Railways has surged by 77% over the past five years, reaching Rs 2.62 lakh crore in FY24. Significant investments have been made in:
- New Line Construction
- Gauge Conversion
- Doubling of Tracks
- Increased Investment: Capital expenditure on Railways has surged by 77% over the past five years, reaching Rs 2.62 lakh crore in FY24. Significant investments have been made in:
- Record Production and Introduction of Vande Bharat Trains
- Production Milestone: Indian Railways achieved its highest-ever production of locomotives and wagons in FY24.
- Vande Bharat Trains: Fifty-one pairs of Vande Bharat trains have been introduced by March 2024.
- Infrastructure Augmentation
- Enhanced Financial Allocation: The fast-paced infrastructure development is attributed to increased financial allocation.
- Efficient Project Management: Close project monitoring and regular follow-up with stakeholders for land acquisition and clearances have expedited project completion.
- Future Train Developments
- Vande Sleeper Trainsets: High-speed, long-distance sleeper trainset coaches are under development. Features include:
- Quick acceleration
- Diffused lighting
- Automatic doors
- GPS-based passenger information system
- Vande Metro Trainsets: Planned for introduction in FY25, these trainsets will feature:
- Sealed wider gangways
- Centrally controlled automatic sliding doors
- CCTV for safety and surveillance
- Route map indicators
- Passenger information and infotainment system
- Fire detection and aerosol-based fire suppression systems
- Vande Sleeper Trainsets: High-speed, long-distance sleeper trainset coaches are under development. Features include:
- Environmental Initiatives
- Bio-Toilets: Conventional toilets on coaches are being replaced with bio-toilets, ensuring cleaner tracks.
- Waste Management: Initiatives include:
- Segregation of biodegradable and non-biodegradable waste
- Solid waste management
- Discouragement of single-use plastics
Key Initiatives in the Railway Sector:
- GatiShakti Multi-Modal Cargo Terminal (GCT)
- Development by Private Players: GCTs are being developed on both railway and non-railway land based on industry demand and cargo traffic potential.
- Current Status:
- 77 GCTs have been commissioned.
- In-principle approval has been issued for 186 locations on non-railway land as of 31st March 2024.
- Signalling and Safety Systems
- Replacement of Mechanical Signalling: Mechanical signalling systems are being replaced with electrical/electronic interlocking systems.
- Eight zones have become free from mechanical signalling.
- Electronic Interlocking (EI) Systems:
- Provided at 443 stations during FY24.
- As of 31st March 2024, EI systems have been installed at 3,424 stations.
- Kavach Automatic Train Protection (ATP) System:
- Deployed on 1,465 route kilometers (RKM) on the South Central Railways.
- Automatic Block Signalling (ABS):
- A low-cost signalling solution implemented on 582 RKM during FY24.
- As of 31st March 2024, ABS has been commissioned on 4,431 RKM on high-density network routes.
- Replacement of Mechanical Signalling: Mechanical signalling systems are being replaced with electrical/electronic interlocking systems.
- Electrification and Sustainability
- Mission 100 Percent Electrification Programme:
- The electrified network of Indian Railways has been extended to 63,456 km (96.4% of the total network).
- Over the past five years (2019-24), electrification has progressed at an average pace of about 5,594 RKM per year.
- Mission 100 Percent Electrification Programme:
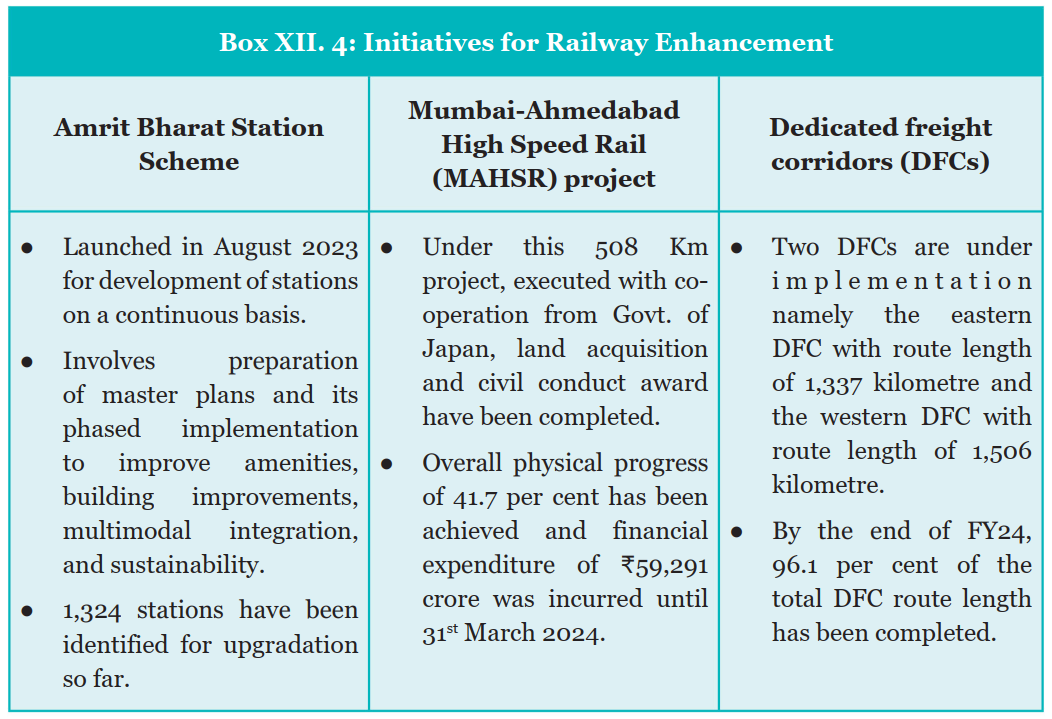
Water Transport:
- Capacity Expansion:
- Major port capacity in India has nearly doubled since 2014.
- Improved connectivity through the PM Gati-Shakti National Master Plan and public-private partnerships has enhanced maritime competitiveness.
- India's rank in the International Shipments category of the World Bank Logistics Performance Index improved to 22nd in 2023 from 44th in 2014.
- Container turnaround time has decreased by 50% between 2014 and 2023-24.
- Union capital expenditure towards the ports, shipping, and waterways sector grew by 27% from FY23 to FY24.
- Sagarmala National Programme:
- Launched in 2015, the Sagarmala programme focuses on five key areas: port modernization, connectivity enhancement, port-led industrialization, coastal community development, and coastal shipping and inland water transport.
- Project Status:
- 262 projects worth Rs 1.4 lakh crore are completed.
- 217 projects worth Rs 1.65 lakh crore are under implementation.
- 360 projects worth Rs 2.7 lakh crore are under development.
- Island Development:
- Vision 2047: Island development will be a key focus, with plans to develop Andaman & Nicobar and Lakshadweep Islands for tourism and other initiatives.
- Maritime India Vision 2030:
- Development will include eco-tourism, ship repair, seaplane building and repair, maritime training institutes, free trade zones, and bunkering terminals.
- Andaman Lakshadweep Harbour Works will develop port infrastructure and provide technical support.
Coastal Shipping and Inland Water Transport:
- Coastal Shipping: Gross tonnage (GT) has increased from 1.19 million GT (846 vessels) on April 1, 2014, to 1.72 million GT (1,039 vessels) on April 1, 2024.
- Inland Water Transport:
- Navigable Waterways:
- India has approximately 14,500 km of navigable rivers, canals, and other waterways.
- Legislative Framework:
- The Inland Vessels Act 2021 replaced the outdated Inland Vessels Act of 1917, aiming to modernize and streamline regulations.
- Capital Expenditure:
- In FY24, the Inland Waterways Authority of India (IWAI) allocated Rs 1,010.5 crore for infrastructure development.
- Projects:
- National Waterways (NWs):
- Feasibility and detailed project reports have been prepared for 106 new NWs.
- Over 63% of the Jal Marg Vikas Project on NW-1 is completed as of March 2024.
- Phase-I development of NW-3, NW-4, NW-5, and 13 new NWs was approved at a cost of Rs 267 crore for 2025-2026.
- Indo-Bangladesh Protocol (IBP) Route:
- Developed jointly by India and Bangladesh at an estimated cost of Rs 305.84 crore.
- Provides alternative connectivity for North-Eastern states from Guwahati and Jogighopa to Kolkata and Haldia ports.
- Significant increase in cargo handled via the IBP route over the last 9 years.
- National Waterways (NWs):
- Navigable Waterways:
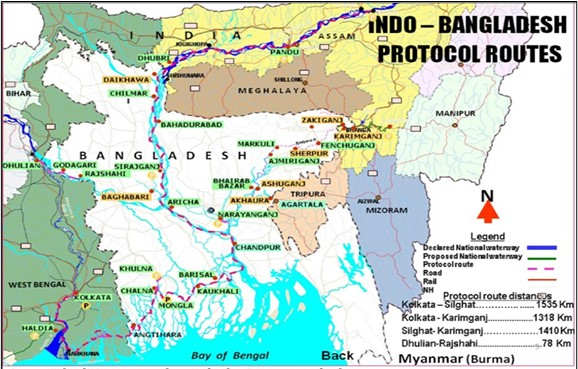
Civil Aviation:
- Capital Expenditure:
- Planned Investment:
- The government has earmarked over Rs 26,000 crore for airport development, upgrading, and modernization from FY20 to FY25.
- Achievements:
- The Airport Authority of India (AAI) has achieved around Rs 23,000 crore of this planned expenditure during FY20 to FY24.
- Private sector investments and other airport operators have spent approximately Rs 49,000 crore during the same period.
- Total capital expenditure in the airport sector over the last five years amounts to around Rs 72,000 crore.
- Planned Investment:
- Greenfield Airports:
- Approvals and Operationalization:
- 21 Greenfield airports received in-principle approval.
- 12 of these airports have become operational.
- Approvals and Operationalization:
- Terminal Expansion:
- New Facilities:
- In FY24, new terminal buildings were operationalized at 21 airports.
- This expansion increased the passenger handling capacity of these airports by approximately 62 million passengers per annum.
- New Facilities:
- UDAN Regional Connectivity Scheme (RCS):
- Routes Awarded:
- Since the inception of the UDAN scheme seven years ago, 1,390 routes have been awarded to various airlines.
- Operationalized Routes:
- 579 RCS routes, connecting 85 unserved and underserved airports, have been operationalized.
- Routes Awarded:
New Segments – Drones, Leasing and MRO
- Drones:
- Liberalized Rules: Introduced in 2021 to support the growth of the drone industry.
- Key Measures:
- Drone airspace maps have been published.
- A Production Linked Incentive (PLI) scheme has been implemented.
- A drone certification scheme has been introduced.
- Progress:
- Training: 109 training organizations established.
- Certificates: 10,603 remote pilot certificates issued.
- Registration: 22,943 unique identification numbers for registered drones.
- Type-Certificates: 67 DGCA-approved Type-Certificates for drone models.
- Aircraft Leasing:
- International Financial Services Centre (IFSC) at GIFT City:
- Promotes aircraft leasing with more than 28 aircraft lessors registered.
- These lessors have leased over 20 aircraft and 49 aircraft engines.
- Air India:
- Commenced leasing wide-body aircraft from the IFSC zone.
- Other Airlines:
- Other airlines are in the process of establishing leasing companies in IFSC.
- International Financial Services Centre (IFSC) at GIFT City:
- Maintenance, Repair, and Overhaul (MRO):
- Policy and Regulations: Government has introduced policies to align India’s MRO sector with global standards.
- Industry Growth: MROs in India have expanded their capacities in airframes and are branching into other segments like engines.
- National Civil Aviation Policy (NCAP-2016): The number of MROs in India has increased from 114 in 2016 to 147.
- Infrastructure: More airports are constructing MRO facilities to enhance capacity and address infrastructure constraints.
Energy Infrastructure
Power Sector:
- Transmission Grid:
- Unified Grid: India operates one of the largest unified electricity grids in the world, running on a single frequency.
- Inter-Regional Capability: Can transfer up to 118,740 megawatts (MW).
- Expansion (as of 31 March 2024):
- Transmission Lines: 485,544 circuit kilometers.
- Transformation Capacity: 1,251,080 mega volt amp (MVA).
- Peak Electricity Demand: Increased by 13% to 243 gigawatts (GW) - FY24
- Sector Enhancement:
- Renewable Energy: Maximum rise in electricity generation recorded in renewable energy resources between FY23 and FY24.
- Electrification:
- Saubhagya Scheme: 2.86 crore households electrified since the launch in October 2017.
- Regulatory Relief:
- Electricity (Late Payment Surcharge and Related Matters) Rules, 2022:
- Impact: Provided relief to Distribution Companies (DISCOMs), electricity consumers, and generating companies.
- Electricity (Late Payment Surcharge and Related Matters) Rules, 2022:
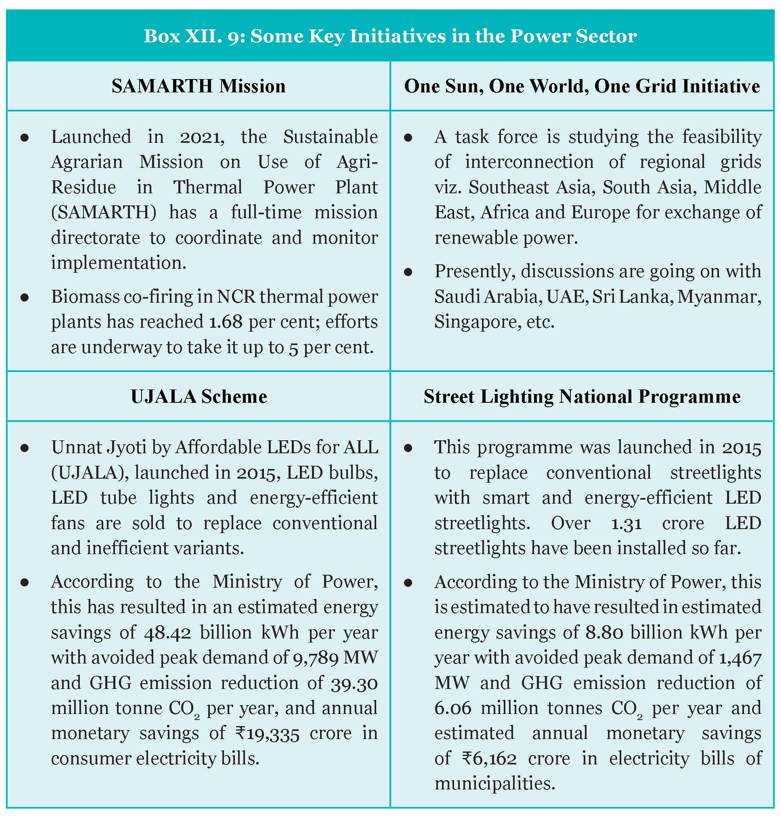
Renewable Sector:
- Climate Goals:
- Updated NDCs: Submitted on 26 August 2022 to the UNFCCC.
- Target: Achieve about 50% cumulative electric power installed capacity from non-fossil fuel-based energy resources by 2030.
- Renewable Energy Capacity:
- Goal: Achieve 500 GW of installed electricity capacity from non-fossil sources by 2030 (Ministry of New and Renewable Energy).
- Current Status (as of 31 March 2024):
- Installed Renewable Energy Capacity: 190.57 GW.
- Share in Total Installed Generation Capacity: 43.12%.
- Investment in Clean Energy:
- Between 2014 and 2023: Rs 8.5 lakh crore (USD 102.4 billion) invested in the clean energy sector.
- Expected Investment (2024-2030): Rs 30.5 lakh crore.
- FDI in RE Sector: Approximately USD 17.88 billion from April 2000 to March 2024.
- Major Programmes, Projects, and Initiatives in the Renewable Energy Sector:
- Solar Energy:
- PM-KUSUM: Focuses on solarizing agriculture pumps and setting up solar power plants on barren land. Significant progress in both components.
- Production Linked Incentive Scheme: Aims to boost domestic manufacturing of high-efficiency solar PV modules. Initial manufacturers have started production.
- Solar Parks: Provides infrastructure for solar power development. Significant capacity commissioned and under implementation.
- PM-Surya Ghar: Targets rooftop solar installations in one crore households.
- CPSU Scheme Phase-II: Promotes solar power projects by PSUs using domestic modules.
- Bioenergy: The National Bioenergy Programme focuses on biomass and waste-to-energy projects. Significant progress in both segments.
- Green Hydrogen: National Green Hydrogen Mission launched with ambitious targets for production and investment.
- Grid Infrastructure: Green Energy Corridors (GEC) being implemented to facilitate renewable power evacuation.
- Solar Energy:
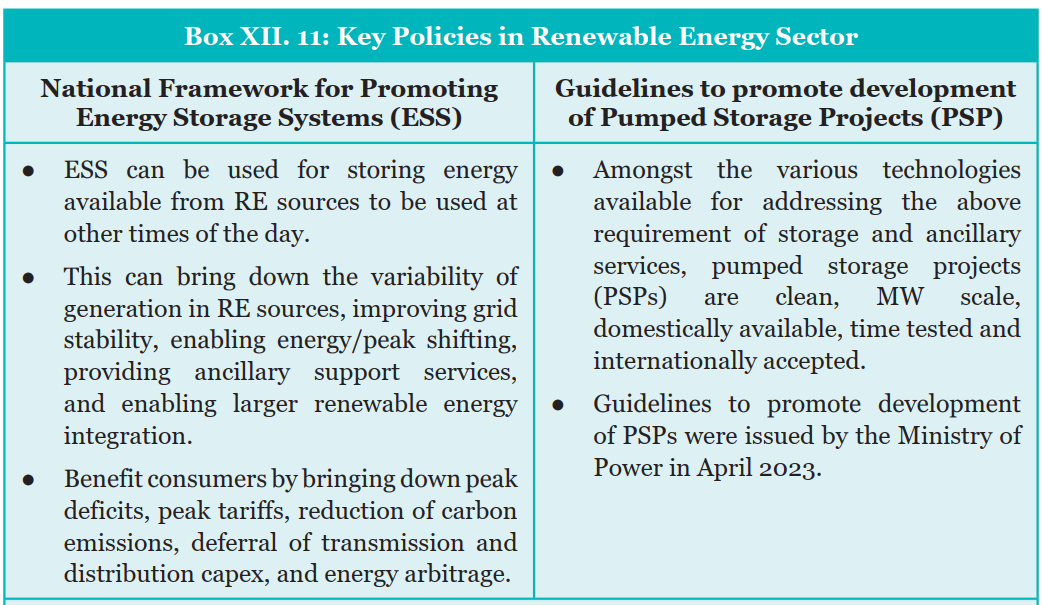
- Challenges in Renewable Energy Sector:
- Mobilisation of the necessary finance and investment on competitive terms: Gearing up the banking sector for arranging finances for larger deployment goals, exploring low-interest rate, long-term international funding, and developing a suitable mechanism for risk mitigation or sharing by addressing both technical and financial bottlenecks.
- Land acquisition: Identification of land with RE potential, its conversion (if needed), clearance from land ceiling Act, decision on land lease rent, clearance from revenue department, and other such clearances take time. State Governments must play a major role in acquisition of land for RE projects.
Social and Economic Infrastructure - Sports Sector
- The Government has been supplementing States and Union territories in their efforts to bridge critical gaps in sports infrastructure in the country.
- Major Programmes, Projects, and Initiatives in Sports Sector:
- Khelo India Programme: Focuses on building sports infrastructure across the country. Significant progress in sanctioning and completing infrastructure projects.
- National Sports Development Fund: Supports both infrastructure and sports promotion projects.
- Sports Authority of India: Actively involved in infrastructure development across different centers.
- National Sports University, Imphal: Aims to create a world-class sports education and training hub.
- Model Concession Agreement (MCA): Facilitates private sector participation in sports infrastructure development through a public-private partnership model.
Water & Sanitation Sector
Swachh Bharat Mission – Grameen (SBM-G):
- Launch and Focus:
- Phase I: Launched in October 2014, aimed at making India open defecation free (ODF) by providing financial incentives for individual household latrines and community sanitary complexes.
- Phase II: Launched to sustain ODF status, manage solid and liquid waste, and transform villages to the ODF Plus Model.
- Total Estimated Outlay for Phase II: Rs 1.4 lakh crore, funded through convergence between different financing verticals and government schemes.
- Achievements in FY24:
- Solid Waste Management: 1,61,525 villages covered.
- Grey Water Management: 2,83,998 villages covered.
- Plastic Waste Management: 2,070 blocks linked with plastic waste management units and material recovery facilities.
- Faecal Sludge Management: 159 districts initiated with faecal sludge management arrangements.
- Financial Utilization: Rs 7,000 crore allocated, with Rs 6,802.58 crore (97%) utilized.
Jal Jeevan Mission (JJM):
- Launch and Focus:
- Launched: August 2019.
- Objective: Provide a tap water connection to every rural household by 2024.
- Total Outlay: Rs 3.6 lakh crore.
- Central Share: Rs 2.08 lakh crore.
- States’ Share: Rs 1.58 lakh crore.
- Demchok village in Leh, located at a height of 13,800 feet where mercury can drop up to minus 40 degrees, got its first tap water connection in July 2022 under the Jal Jeevan Mission.
- A remote tribal village of Bulumgavan in Maharashtra received electric supply only in 2018, 70 years after independence.
- Progress:
- Initial Coverage: 3.23 crore rural households (17%) had tap water connections at the inception of the mission.
- Current Coverage: More than 14.89 crore rural households (76.12%) now have tap water connections.
| Steel (Barthan) Bank Initiative in Siddipet District, Telangana |
The Initiative: The initiative emerged from the Kanti-Velugu program in 2022, a state-wide eye testing program. It aimed to address the challenge of managing plastic waste, particularly from disposable utensils used during medical camps.
Benefits
|
| Sailam: A Model Village for Sustainable Rural Water Supply in Mizoram |
Objective: Under the Jal Jeevan Mission (JJM), Sailam village has been transformed from water-scarce to water-sufficient, achieving the status of a 'Har Ghar Jal' village. Key achievements:
|
Water Resource Management Sector
Namami Gange Programme: National Mission on Clean Ganga (NMCG):
- Overview
- Launch: 2014-15
- Objective: Integrated conservation mission focused on pollution abatement, conservation, and rejuvenation of the Ganga River.
- Key Features
- Hybrid Annuity Model (HAM)
- Funding Structure:
- 40% of capital expenditure (capex) is paid during the construction phase.
- The remaining 60% is paid over a 15-year period in annuity payments along with interest.
- Separate payments are made for Operation and Maintenance (O&M).
- Current Status: 33 projects have been sanctioned under HAM.
- Funding Structure:
- One City-One Operator Model
- Objective: Integrate existing Sewage Treatment Plants (STPs) with newly sanctioned projects.
- Implementation: Existing STPs in towns are being integrated with new projects and tendered under the HAM-based PPP mode.
- Hybrid Annuity Model (HAM)
- Implementation
- The Hybrid Annuity Model allows for efficient funding and management of sewage treatment infrastructure, aiming to improve overall efficiency and sustainability of the sewage treatment plants.
- The ‘One City-One Operator' approach ensures streamlined management and integration of STPs, promoting better maintenance and operational efficiency.
- Expected Outcomes
- Pollution Abatement: Reduction in pollution levels in the Ganga River.
- Conservation and Rejuvenation: Improved ecological health of the river.
- Enhanced Infrastructure: Modernized and efficient sewage treatment systems.
Major Programmes Water Resource Sector:
- Dam Rehabilitation and Improvement Project (DRIP)
- Objective: Improve safety and operational performance of existing dams and strengthen dam safety institutions.
- Financial Assistance: World Bank.
- Phase I (2012-21): 223 dams rehabilitated
- Phase II & III (2021-31): Rehabilitation of 736 dams. 19 states and three central agencies are involved.
- Atal Bhujal Yojana
- Objective: Focus on demand-side groundwater management and community behavioural change.
- Outlay: Rs 6,000 crore, World Bank-aided, implemented from April 2020 for five years.
- Coverage: 8,213 water-stressed gram panchayats in 229 blocks/talukas across seven states.
- Achievements:
- Water budget & security plans prepared by communities.
- Improvement in groundwater decline rate in 47 blocks and 813 GPs.
- Pradhan Mantri Krishi Sinchayee Yojana (PMKSY)
- Objective: Enhance water access on farms, expand irrigation areas, improve water use efficiency, and promote sustainable practices.
- Components:
- Accelerated Irrigation Benefit Programme (AIBP)
- Har Khet Ko Pani (HKKP)
- Interlinking of Rivers Project
- Scope: 30 links identified (16 Peninsular, 14 Himalayan).
- Priority Links: Ken-Betwa, Modified Parbati-Kalisindh-Chambal, Godavari-Cauvery.
- Ken-Betwa Link: First link approved in 2021 with Rs 39,317 crore central support, involving Madhya Pradesh, Uttar Pradesh, and the Union Government.
- PRAYAG (Platform for Real-Time Analysis of Yamuna, Ganga, and Tributaries)
- Launch: April 2023.
- Function: Online dashboard for continuous monitoring of river quality and sewage treatment infrastructure.
- Global River Cities Alliance
- Objective: Unique alliance for river conservation and sustainable water management, covering 275 cities in 11 countries.
- Groundwater Management & Regulation (GWMR) Scheme
- Monitoring: 26,000 groundwater stations, over 5,000 with digital water level recorders.
- Artificial Recharge: 300 demonstrative structures created.
- Water Bodies Census 2023
- Enumeration: 24,24,540 water bodies; 97.1% in rural areas, 2.9% in urban areas.
- Dam Safety Act 2021
- Objective: Holistic approach to dam safety, including surveillance, inspection, and maintenance.
- Coverage: All large dams in India (6,281 as per the National Register of Large Dams 2023).
- Technological Innovations
- Developed Platforms: WQMIS, India-WRIS Portal, PM GatiShakti NMP portal for improved data-led water governance.
Urban Sector
Housing for All Initiatives:
- Pradhan Mantri Awas Yojana-Urban (PMAY-U)
- Objective: Provide pucca houses with basic amenities to all eligible beneficiaries in urban areas.
- Progress:
- Sanctioned Houses: 1.18 crore
- Grounded for Construction: 1.14 crore
- Completed/Delivered: 84 lakh
- Extension: The scheme has been extended until 31st December 2024.
- Affordable Rental Housing Complexes (ARHCs)
- Objective: Improve living conditions for urban migrants and the poor, and reduce reliance on slums, informal settlements, or peri-urban areas.
Swachh Bharat Mission Urban (SBM-U):
- Objectives
- Sanitation Facilities: Ensure every citizen, including those in poor households, has access to sanitation facilities.
- Open Defecation Free (ODF) Status: Achieve ODF status in urban areas.
- Garbage-Free Cities: Attain garbage-free status through:
- 100% source segregation
- Door-to-door collection
- Scientific management of all types of waste
- Achievements
- Individual Household Latrine (IHHL) Units:
- Target Achievement: 113.75% of the target
- Community and Public Toilets:
- Target Achievement: 128% of the target
- Individual Household Latrine (IHHL) Units:
Case Studies on Swachh Bharat Mission Urban (SBM-U)
|
Atal mission for rejuvenation and urban transformation (AMRUT):
- AMRUT Launch and Goals: Launched in June 2015 in 500 cities, AMRUT aims to provide safe and assured drinking water universally.
- Project Awards and Completion: 5,999 projects worth Rs 83,327 crore were awarded; 5,304 projects worth Rs 51,434 crore (62%) were completed.
- Reforms and Milestones: AMRUT includes eleven reforms with 54 milestones for States and Union Territories to enhance service delivery, resource mobilization, and transparency.
- AMRUT 2.0 Launch: Launched in October 2021 for five years, focusing on self-reliance, water security, universal sewerage, and rejuvenation of water bodies in 500 AMRUT cities.
- Major Reforms in AMRUT 2.0: Includes property tax and user charge notifications, enhancing financial sustainability, recycling 20% of treated water, double entry accounting, efficient town planning, and mandatory PPP projects worth 10% of allocations in million-plus cities.
Smart Cities Mission (SCM):
- SCM Launch and Objectives: Launched in June 2015, the Smart Cities Mission (SCM) aims to enhance urban infrastructure, create a clean and sustainable environment, and improve the quality of life through smart solutions.
- City Selection and Project Progress: 100 cities have been selected for development. As of June 20, 2024, 100 Special Purpose Vehicles (SPVs) have initiated 8,011 multi-sectoral projects worth approximately Rs 1.64 lakh crore.
- Project Completion: Of these projects, 7,153 (89%) worth Rs 1.43 lakh crore (87%) have been completed.
Tourism Sector
- PRASHAD Scheme: Focuses on enhancing tourism infrastructure at pilgrimage and heritage sites.
- 29 new sites have been identified.
- Swadesh Darshan 2.0: Revamped scheme with an outlay of Rs 3,800 crore, aimed at integrated development of tourism destinations.
Strategic Infrastructure - Space Sector
- Space Sector Progress: India has made significant advancements in rockets, satellites, spacecraft, and ground infrastructure.
- Active Space Assets: India operates 55 active space assets, including 18 communication satellites, nine navigation satellites, five scientific satellites, three meteorological satellites, and 20 Earth observation satellites.
- Launch Vehicles: ISRO's fleet includes Polar Satellite Launch Vehicle (PSLV), Geosynchronous Satellite Launch Vehicle (GSLV), and newly added Launch Vehicle Mark-3 (LVM3) and Small Satellite Launch Vehicle (SSLV).
- Space Exploration Missions: Notable missions include Mars Orbiter Mission (2014), ASTROSAT (2015), Chandrayaan-2 (2019), Chandrayaan-3 (2023), and Aditya-L1 (2023).
- NavIC Constellation: India's indigenous satellite navigation system was completed and operationalized in 2016.
- New Space India Limited (NSIL): Successfully launched 72 OneWeb satellites to Low Earth Orbit using LVM3, enhancing LVM3's reputation in the global commercial launch market.
Private participation in the Space sector
|
Digital Infrastructure
- Construction Sector Contribution: The construction sector accounts for around 9% of India’s annual Gross Value Added (GVA) in 2023-24 but remains one of the least digitised sectors.
- Technological Integration: Recent years have seen increased integration of technology in infrastructure development to enhance efficiency in planning, design, and asset management.
- Key Technologies and Platforms:
- PM GatiShakti: Aims to improve infrastructure planning and execution.
- Bhuvan and BharatMaps: Provide geospatial data and mapping services.
- Single Window Systems: Simplify project approvals and processes.
- PARIVESH Portal: Facilitates environmental clearance processes.
- National Data Analytics Platform: Aggregates and analyses data for better decision-making.
- Unified Logistics Interface Platform: Enhances logistics efficiency.
- PRAGATI (Pro-Active Governance and Timely Implementation): Addresses project implementation challenges.
- India Investment Grid (IIG): Provides a platform for investment opportunities and project tracking.
Telecommunication Sector
- Telecommunications Act 2023: Enacted to update and consolidate laws related to telecommunication services, spectrum assignment, and related matters.
- Mobile Infrastructure: As of June 2024, India has 8.02 lakh mobile towers, 29.37 lakh Base Transceiver Stations (BTSs), and 4.5 lakh 5G BTSs.
- 4G Saturation Project: A Rs 26,316 crore initiative to extend 4G mobile services to 24,680 uncovered villages and upgrade 6,279 villages from 2G/3G to 4G.
- Telecom Test Labs: Over 69 labs are designated as conformity assessment bodies, equipped to test telecommunications equipment for functionality, reliability, and interoperability.
- Spectrum Regulatory Sandbox (SRS) and WiTe Zones: Introduced to foster innovation and "Make in India" in telecommunications. Provides a simplified regulatory framework for R&D and spectrum exploration. WiTe Zones are categorized into urban and remote areas for experimentation and include eligibility for academia, R&D labs, and telecom providers.
BharatNet Project
|
Electronics & Information Technology Sector
- India AI Programme: Aims to leverage AI for social impact through pillars such as AI in Governance, AI IP & Innovation, AI Compute & Systems, Data for AI, Skilling in AI, and AI Ethics & Governance. The first edition of IndiaAI was released in October 2023.
- Global Partnership on Artificial Intelligence (GPAI): India is a founding member, joined in June 2020, and has contributed significantly. India served as Incoming Council Chair in 2023, Lead Chair in 2024, and Outgoing Chair in 2025. The Union Cabinet approved Rs 10,300 crore for the IndiaAI Mission to boost global competitiveness.
- AIRAWAT: An AI supercomputer at C-DAC, Pune, ranked 75th in the top 500 global supercomputing list at the International Supercomputing Conference 2023 in Germany.
- Digital India Programme: Launched in July 2015 to enhance digital services:
- MeriPehchaan (National Single Sign-On - NSSO): Allows access to over 9,600 services with a single set of credentials.
- DigiLocker: Provides digital storage, issuance, and verification of documents, with over 26.28 crore users and 674 crore documents.
- UMANG (Unified Mobile Application for New-age Governance): Delivers 2,019 services from 207 Central and State Government departments through a single app.
GI Cloud - ‘MeghRaj’
|
Challenges and Opportunities
- Land-Related Issues:
- Delays in land acquisition and clearances for infrastructure projects.
- Slow onboarding of digital land records.
- Greenfield airport projects are time-intensive due to site selection and approvals.
- Skill Demands:
- Limited technical knowledge in sectors like aviation maintenance and manufacturing.
- Need for skill development in MRO, leasing, and project management.
- Essential for effective public-private partnerships and addressing industry-specific shocks.
- Private Sector Participation:
- Predominantly public sector-financed infrastructure growth.
- Challenges include high capital investment, long payback periods, project structuring issues, clearance delays, and lack of independent regulation.
- Need for improved private sector engagement through innovative financing models and better contract management.
- Climate and Environmental Sustainability:
- Compliance with international standards like CORSIA for aviation, including the use of sustainable aviation fuel (SAF) or carbon offsets.
- High cost of SAF and lack of ICAO-approved emissions unit programs in India.
- Infrastructure Financing Aggregation:
- Complex financing structure with multiple stakeholders and instruments.
- Challenges in aggregating financial flows due to varying reporting formats and insufficient data on capital expenditure.
- Issues with double-counting and the need for comprehensive and consistent data.
- Monitoring Physical Progress:
- Lack of a unified source for tracking infrastructure project progress across sectors.
- Need for better coordination among central, state, and local governments, and public and private partners to evaluate project progress effectively.
Facilitation and Addressing the Bottlenecks
- Centralised Monitoring and Tracking - Utilise the NIP Portal Effectively:
- Centralised Data Collection: Ensure that all Ministries and States/UTs consistently update and maintain their project data on the NIP portal. This will provide a real-time overview of project progress and potential investment opportunities.
- Regular Reviews and Updates: Conduct periodic reviews of the portal to ensure data accuracy and to track the progress of ongoing and completed projects.
- Strengthen Institutional Mechanisms - Project Monitoring Group (PMG):
- Expedite Issue Resolution: Empower the PMG to resolve issues swiftly by streamlining communication channels between project proponents and government agencies.
- Expand PMG Capabilities: Increase the capacity of PMG to handle more projects and issues concurrently, ensuring timely interventions.
- Inter-Ministerial and State Collaboration - PM GatiShakti National Master Plan (PMGS-NMP):
- Integrated Planning: Encourage collaboration among the 43 Ministries onboarded on the PMGS-NMP portal for integrated multimodal infrastructure planning.
- Address Last-Mile Connectivity: Focus on identifying and resolving last-mile connectivity gaps to enhance the efficiency of logistics and movement of people and goods.
- Regular Coordination Meetings: Schedule frequent meetings between Ministries and States to discuss progress, share best practices, and resolve interdepartmental issues.
- Focus on Capacity Building and Technological Adoption
- Skill Enhancement Programs: Organise training programs for government officials and project managers on the use of the NIP and PMGS-NMP portals, as well as on best practices in project management and issue resolution.
- Technology Adoption: Promote the use of advanced technologies like AI, big data analytics, and blockchain for better project tracking, management, and transparency.
- Encourage Private Sector Participation
- Engage with Investors: Use the NIP portal to showcase investment opportunities to both national and international investors, highlighting the benefits and potential returns.
- Public-Private Partnerships (PPP): Foster PPP models to leverage private sector expertise, efficiency, and capital in executing infrastructure projects.
- Continuous Improvement and Feedback
- Stakeholder Feedback: Establish a robust feedback mechanism where project proponents, investors, and other stakeholders can provide input on the NIP and PMGS-NMP processes.
- Iterative Improvements: Use the feedback to make continuous improvements to the portals, processes, and policies to enhance overall efficiency and effectiveness.
Implementation of NLP gains steamOverview: India has significantly improved its logistics infrastructure, climbing from 44th in 2018 to 38th in 2023 in the World Bank's Logistics Performance Index among 139 countries. Launched in September 2022, the National Logistics Policy (NLP) aims to enhance business competitiveness through an integrated, efficient, sustainable, and cost-effective logistics network, leveraging advanced technology and processes. Objectives: The primary objectives are to reduce logistics costs, improve India's Logistics Performance Index ranking, and create a data-driven decision support mechanism. Key Action Areas and Progress:
|
Conclusion & Outlook
Over the last decade, India has seen significant advancements in infrastructure, focusing on road, rail, air connectivity, sanitation, and digital infrastructure. Despite this progress, infrastructure development has been largely driven by public sector funding, with the central and state governments contributing 49% and 29% of investments respectively between 2019 and 2023, while the private sector contributed 22%.
To sustain and enhance infrastructure quality, increased private sector financing and innovative resource mobilisation methods are necessary. This requires supportive policies from all levels of government. Improved data capture and reporting mechanisms are also essential for better infrastructure investment insights. Although various databases like the National Infrastructure Pipeline and the PPP India Portal exist, they face challenges such as inconsistent data collection and methodological discrepancies. Consolidating this data under a unified framework with regular updates and clear public-private distinctions would aid policymakers in resource allocation and infrastructure planning.
13 - Climate Change and India: Why We Must Look at the Problem Through Our Lens
Mata Bhumi Putroham Prithivyah
[Earth is my mother and I am her son]
Introduction
- India has a long-standing tradition of sustainability and harmony with nature.
- Despite being a significant contributor to the global economy, India is facing pressure to reduce carbon emissions.
- The global focus on a 1.5-degree Celsius temperature increase raises questions about the effectiveness and fairness of the current approach.
- This essay will examine global climate change strategies, their limitations, and propose a more sustainable alternative centered on India's ethos (Mission LiFE).
India’s Achievements Against Targets for Climate Change
|
Climate Change and the Global Approach
- Impact of CO2 Emissions:
- Primary Contributor: Greenhouse gases, particularly CO2, are major contributors to climate change.
- Longevity: CO2 can remain in the atmosphere for 300 to 1000 years, leading to long-term global warming and environmental damage, such as polar ice cap melting.
- Global Climate Strategy:
- Climate Adaptation: Measures to adjust to the impacts of climate change.
- Climate Mitigation: Efforts to reduce or prevent the emission of GHGs.
- Key Actions:
- Transitioning to non-fossil fuel energy sources.
- Improving energy efficiency through innovative and eco-friendly designs.
- Implementing regenerative and environmentally sensitive agricultural practices.
- Protecting and restoring natural ecosystems.
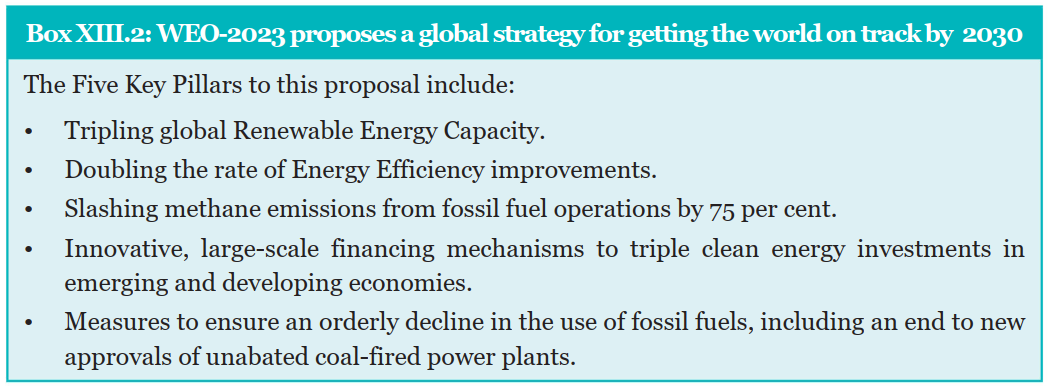
Why is the Current Approach Flawed?
The current approach to climate change is considered flawed for several reasons:
- Insufficient Carbon Budget and Accelerating Timeframe:
- The IPCC's defined carbon budget for limiting global warming to 1.5°C is approximately 500 GtCO2, while for 2°C it's around 1150 GtCO2 (with varying probabilities).
- Each passing year reduces this budget, leaving less time for effective action.
- Global nations face challenges in meeting rapid emission reduction targets while balancing economic development.
- Fundamental Flaws in Understanding and Approach:
- A limited understanding of Earth's natural systems hinders effective solutions.
- Reliance on artificial mechanisms cannot fully replace natural processes.
- Current strategies often ignore regional differences and valuable, nature-based solutions.
- Overconsumption in developed nations is a core issue not adequately addressed.
- A philosophical shift towards understanding human-nature interaction is needed.
- The Energy Conundrum:
- The power industry (including transport) is the primary GHG emitter, followed by industrial combustion, agriculture, and waste.
- Beef production, a significant contributor, lacks sufficient regulatory changes.
- Even renewable energy sources have environmental impacts, such as material extraction, production, and disposal.
- The distinction between energy and power is often misunderstood, leading to ineffective policies.
- Achieving net zero carbon is a massive challenge involving replacing vast energy infrastructure and developing new technologies within a short timeframe.
- Economic Growth vs. Environmental Sustainability:
- The focus on replacing fossil fuels with renewables often overlooks overconsumption.
- The creation of a "sustainability industry" can overshadow genuine behavioral change.
- The rise of AI and data centers is increasing energy demand, potentially undermining climate goals.
- Developing nations, with lower historical emissions, face unfair burdens in reducing current emissions.
- Inadequate climate financing hinders developing countries' ability to adapt and mitigate.
- Specific Examples:
- The use of virgin wood for toilet paper in developed countries highlights unsustainable practices.
- Cobalt extraction for lithium-ion batteries often involves human rights abuses.
- France's solar panel mandate focuses on power generation rather than energy consumption.
- The energy consumption of a single ChatGPT search is significantly higher than a Google search.
- The top 10% of global emitters consume 22 tonnes of CO2 per capita, compared to less than 1 tonne for the bottom 10%.
- Climate finance often comes in the form of loans rather than grants, increasing debt burdens.
The Indian Way: A Sustainable Lifestyle
- Philosophical Resilience:
- Spiritual Understanding: India’s resilience in facing adversities is rooted in its deep spiritual and philosophical understanding of natural cycles of creation and destruction.
- Harmony with Nature:
- Respect for Natural Laws: India emphasizes being in sync with Nature’s immutable laws rather than attempting to alter them through industrial means. The belief is that global environmental strategies should align with Nature's cyclical nature.
- Integrating Ancient Wisdom:
- Sustainable Lifestyle: India advocates for integrating its ancient wisdom of sustainable living into modern climate strategies. This involves recognizing the impact of individual actions on both emission generation and reduction.
- Ancient Wisdom in Modern Context:
- Scriptural Reflection: The Sukla Yajurveda verse reflects the ancient Indian value of balance and harmony in all aspects of life, from the environment to human actions.

Mission Life (Lifestyle For Environment)
Mission LiFE (Lifestyle for Environment) was introduced by Prime Minister Modi at the 2021 UN Climate Change Conference (UNFCCC COP26). It emphasises individual responsibility and aligns with ancient Indian philosophies advocating for a naturally sustainable lifestyle. The initiative outlines a comprehensive, though not exhaustive, list of 75 actions for individuals to adopt in order to live more sustainably.
5 Fundamental Principles of Mission LiFE:
- Harmony with Nature:
- Principle: Align personal and collective actions with the natural world’s rhythms and laws.
- Focus: Embrace practices that respect and integrate with natural cycles rather than attempting to override them.
- Individual Responsibility:
- Principle: Recognize that every person has a role in reducing emissions and promoting sustainability.
- Focus: Encourage individuals to make eco-friendly choices and integrate sustainable practices into daily life.
- Collective Demand for Pro-Planet Choices:
- Principle: Shift collective behaviour towards sustainability by influencing demand patterns and societal norms.
- Focus: Promote and normalise sustainable choices in consumption, lifestyle, and community activities.
- Integration of Ancient Wisdom:
- Principle: Apply ancient Indian principles of balance and harmony to modern environmental strategies.
- Focus: Use traditional knowledge to guide contemporary practices and policies for sustainable living.
- Comprehensive Action Framework:
- Principle: Implement a broad range of actions tailored to different aspects of life and levels of society.
- Focus: Provide a detailed but adaptable list of actions that individuals and communities can take to live sustainably.
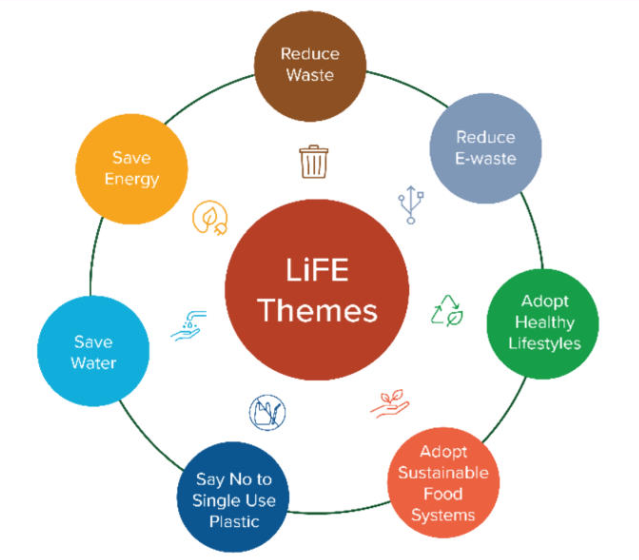
Individual Action: The Core of Climate Responsibility
- Role of Individual Behavior:
- Personal actions can significantly influence climate outcomes. For instance, using cloth for cleaning instead of tissue paper, opting for reusable plates, and adopting water-based cleaning systems are sustainable practices ingrained in many cultures, including India’s.
- Traditional practices, such as using home remedies for pest control or conserving resources through upcycling and repair, reflect a deep-rooted culture of sustainability that contrasts with modern capitalistic tendencies favoring disposable goods and fast fashion.
- The Case for Behavioural Change:
- Emphasising voluntary changes in consumption and lifestyle, such as reducing energy use, embracing e-bills, or switching to energy-efficient products, can drive substantial environmental benefits.
- Encouraging individuals in developed countries to voluntarily relinquish high-consumption habits—like excessive beef consumption and fast fashion—can shift demand patterns, which in turn will influence supply chains and production practices.
- India’s Historical Context of Voluntary Simplicity:
- India's tradition of voluntary renunciation, as seen in the ‘Give It Up’ LPG Subsidy Scheme, showcases how collective voluntary action can lead to significant positive outcomes. By surrendering subsidies, individuals helped provide cleaner cooking alternatives to rural women, reducing black carbon emissions and health hazards.
- Such historical practices of simplicity and community welfare have modern applications. Voluntary actions like tree planting, minimalist living, and support for local, sustainable products align with these values.
- Water Conservation:
- Water, a critical resource for life, demands particular attention. Individual efforts in water conservation—such as reusing kitchen water, avoiding unnecessary water wastage, and implementing rainwater harvesting—are crucial.
- Despite government efforts to manage water resources, personal responsibility in reducing water usage is indispensable for ensuring long-term sustainability.
Collective Policy: A Reflective of Individual Pro-Planet Choices
Key Areas of Policy and Individual Alignment
- Optimising Air Conditioning Usage:
- Policy: Governments can set default temperature guidelines for air conditioners in public spaces, aiming for a more sustainable range (e.g., 24-25 degrees Celsius).
- Individual Action: People should adopt similar practices at home and workplaces. Combining modern cooling systems with traditional methods, such as water coolers and ventilation, can reduce the reliance on air conditioning.
- Reducing Plastic Bag Usage:
- Policy: Implement and enforce bans or taxes on single-use plastic bags, promoting the use of reusable fabric alternatives.
- Individual Action: People should carry reusable bags for shopping and other errands to minimise plastic waste.
- Promoting Water Reuse:
- Policy: Mandate water-efficient technologies and design specifications like rainwater harvesting systems in new constructions. Reevaluate and phase out water-wasting technologies.
- Individual Action: Adopt water-saving practices at home, such as collecting and reusing kitchen water and using rainwater for gardening.
- Encouraging Sustainable Agriculture:
- Policy: Support sustainable farming practices through subsidies or incentives. Encourage the use of local seeds and natural farming techniques.
- Individual Action: Support and buy from local farmers practising sustainable agriculture. Use composting and mulching to reduce waste.
- Fiscal Incentives for Sustainable Choices:
- Policy: Offer tax benefits or financial incentives for larger households or those making sustainable choices.
- Individual Action: Opt for sustainable products and practices that align with fiscal incentives.
Enhancing Market Demand for Sustainable Products
- Traditional Products: Increased demand for sustainable, locally-made products can revitalise traditional crafts and reduce reliance on global supply chains.
- Regulations: Ban products made from endangered species or those contributing significantly to environmental harm (e.g., ivory, leather). Encourage circular economy practices through government incentives.
- Fashion and Textiles:
- Policy: Implement a Circularity in Textiles policy to increase textile waste reuse, repair, and remanufacturing.
- Individual Action: Practice and support voluntary reuse and upcycling of clothing. Opt for sustainable fashion brands and products.
Incorporation of local and sustainable geography and culture
- Embracing Local Food Systems
- Local Food Values: Traditional Indian cuisine emphasises plant-based foods, reflecting a deep connection to local geography and its benefits. This approach reduces ecological footprints and minimises energy requirements compared to global food systems that rely on imported ingredients like avocados or soy milk.
- Sustainable Eating Practices: The principle of "eat local, eat fresh, eat sustainably" encourages the consumption of local and seasonal foods, which supports local agriculture and reduces the need for long-distance transportation.
- Health and Ayurveda
- Ayurvedic Wisdom: Ayurveda, with its focus on living in harmony with nature and prioritising prevention over treatment, offers valuable insights into health. It promotes natural remedies and dietary practices that align with local resources and environmental conditions.
- Reducing Reliance on Pharmaceuticals: By adopting Ayurvedic principles and focusing on natural, locally sourced remedies, individuals can potentially reduce reliance on pharmaceuticals and minimise associated long-term health risks.
- Sustainable Ingestion Practices
- Plant-Based Diet: Emphasising a plant-based diet supports environmental sustainability and aligns with traditional dietary practices that rely heavily on local, plant-based foods.
- Leaf-Based Disposables: Using leaf-based plates instead of single-use plastics or Styrofoam reduces waste and supports traditional, biodegradable alternatives.
- Fermented Products: Incorporating fermented products that utilise natural preservation methods can decrease the need for energy-intensive food preservation techniques.
- Food Waste Management: Upcycling food waste and organic composting contribute to waste reduction and resource efficiency. For example, sour milk can be used to make paneer, and whey water can be reused in cooking.
- Medicinal Herbs: Growing and utilising local medicinal herbs like Tulsi and neem can enhance health and promote biodiversity.
- Afforestation and Water Conservation: Planting trees that help in water-table conservation and other environmental benefits supports ecosystem health.
- Seasonal and Local Eating: Prioritising seasonal and locally available foods, such as millets over quinoa, helps in reducing the carbon footprint associated with food production and transportation.
- Natural Varieties and Seed Harvesting: Incentivizing the production of natural seed varieties and local seed harvesting supports agricultural biodiversity and sustainability.
- Policy and Community Integration
- Public Incentives: Governments and organisations should incentivize the production of natural food varieties and local seed harvesting. Supporting local agriculture through policies and subsidies can encourage sustainable practices and reduce dependency on imported goods.
- Cultural Integration: Integrating traditional knowledge and practices into modern sustainability efforts can create a more holistic approach to environmental conservation and health.
Public Policy and Not the Market at the Helm of Undertaking the ‘Right’ Decision
- Role of Policy and Infrastructure
- Influencing Consumption Patterns: Individual behaviours and consumption choices are strongly shaped by surrounding norms, policies, incentives, and infrastructure. Governments, community leaders, and media play crucial roles in shaping these factors.
- Case Study: Ujala Program: Launched in 2015, the Ujala program successfully promoted the adoption of energy-efficient LED lights. By reducing the cost of LED lights through bulk procurement and supply, the program achieved significant energy savings of around 48 billion kWh per year and USD 2.5 billion in annual savings. This initiative demonstrates how policy-driven incentives can lead to widespread behavioural change and climate mitigation.
- Demand-Side Transformation
- Importance of Behavioural Change: The LiFE initiative aims to reduce annual global CO2 emissions by over 2 billion tonnes (20% of the needed reductions by 2030) and generate consumer savings of about USD 440 billion. This highlights the significant impact of transforming individual and collective behaviours on climate mitigation.
- Radical Consumption Pattern Shifts: To stay within planetary boundaries, it's crucial to not only utilise efficient technologies but also transform consumption patterns. Political procedures and policies must prioritise competing consumption claims to support these changes.
- Public Investment in Transformational Projects
- Historical Precedents: Major historical projects, such as post-WW II reconstruction, space exploration, the development of the internet, and the U.S. highway construction, were spearheaded by public sector investments. These initiatives demonstrated the effectiveness of public funding in driving large-scale transformations.
- Current Needs: Today, there is a pressing need for public investment in areas such as carbon sequestration, carbon sinks, battery storage technologies, and green hydrogen. Such investments can address intellectual property issues and underscore the global public nature of these solutions.
- Awareness and Education
- Campaigns for Behaviour Change: Effective awareness campaigns are essential for encouraging behavioural change. The Mission LiFE initiative should be supported by comprehensive campaigns similar to the Open Defecation Free (ODF) campaign in Swachh Bharat. Initiatives should start early, from school onwards, to instill sustainable practices and environmental consciousness in future generations.
- Strategic Recommendations
- Integrated Policy Approaches: Develop policies that incentivize sustainable behaviors and integrate them with infrastructure improvements. For example, incentivizing the use of energy-efficient appliances, promoting public transportation, and supporting local and sustainable food systems.
- Public Sector Leadership: Advocate for increased public sector investments in green technologies and transformational projects. Ensure these investments are designed to be inclusive and globally accessible.
Mindful Consumption of Resources, Based on Need and not Greed
- Critique of Capitalism and GDP Measures
- Capitalism and Energy Transition: Despite advances in cleantech and renewable energy, the share of fossil fuels in global energy use has only decreased slightly from 86% in 2000 to 82% in 2023. This suggests that capitalism, as it currently operates, may not be effective in driving the energy transition swiftly enough (Derek Brower, Amanda Chu, and Myles McCormick, FT).
- GDP as a Measure of Worth: The predominant measure of a country’s value often comes from its GDP, which is driven by consumption. This focus on increasing GDP can encourage unsustainable consumption patterns and environmental degradation.
- Encouraging Sustainable Lifestyles
- Shift in Lifestyle: Emphasizing low wastage and adjusting lifestyles so that "wants" don’t become "needs" is crucial. This approach fosters living well in harmony with the environment rather than pursuing material excesses.
- Negative Externalities of Materialism: Excessive materialism leads to increased waste, litter, and environmental degradation. The law of diminishing marginal utility highlights that beyond a certain point, increased material consumption yields diminishing returns in happiness.
- The Paradox of Choice
- Choice Overload: Research on the ‘Paradox of Choice’ suggests that while having options is beneficial, an overload of choices can lead to negative outcomes such as indecisiveness, confusion, and dissatisfaction. This contradicts the capitalist notion that more choice inherently leads to greater happiness (Oscar Wilde, "The Picture of Dorian Gray").
- Strategic Recommendations
- Redefining Value Metrics: Shift from GDP-centric measures of progress to metrics that account for environmental sustainability and quality of life. Implement indicators that reflect well-being, environmental health, and resource efficiency.
- Promote Sustainable Consumption: Encourage policies and cultural shifts that promote sustainable consumption practices. Highlight the benefits of reducing waste, choosing durable goods, and valuing experiences over material possessions.
Conclusion
By fostering inner peace (Thahraav), we can resist excessive consumption driving waste and environmental harm. Historically shared resources contrast today's individualistic culture. To combat this, we must align personal choices with environmental needs and integrate economic decisions with sustainability goals.


