Indian Economy
Poverty and Inequality Measures in India
- 28 Jun 2024
- 13 min read
Prelims: PM’s Economic Advisory Council (PMEAC), Poverty Line, World Bank, VM Dandekar and N Rath, Alagh Committee, Lakdawala Committee, Tendulkar Committee, Rangarajan Committee, Price Index of Industrial Workers (CPI-IW), Consumer Price Index of Agricultural Labour (CPI-AL), National Sample Survey (NSS), GST, Multidimensional poverty Index, Inflation, Gini coefficient, Household Consumption Expenditure Survey.
Mains: Issues Related to Poverty Estimation and Status of Inequality in India
Why in News?
Recently, PM’s Economic Advisory Council (PMEAC) chief Bibek Debroy pitched for a review of India’s official poverty line and suggested analysing inequality at the state level.
What is the Status of Poverty in India?
- About:
- Poverty refers to a condition in which people or communities lack the financial resources and other essentials for a minimum standard of living.
- In September 2022, the World Bank set the International Poverty line at USD 2.15 using 2017 prices.
- It means that anyone living on less than USD 2.15 a day is considered to be living in extreme poverty.
- Poverty Estimation in India:
-
Study by VM Dandekar and N Rath (1971): It made the first systematic assessment of poverty in India.
- It was based on National Sample Survey (NSS) data from 1960-61.
- They argued that the poverty line must be derived from the expenditure that was adequate to provide 2250 calories per day in both rural and urban areas.
- Alagh Committee (1979): It constructed a poverty line for rural and urban areas on the basis of nutritional requirements.
- Nutritional requirements and related consumption expenditure based on 1973-74 price levels recommended were 2400 Calories for rural areas (Rs 49.1 per capita per month) and 2100 Calories for urban areas (Rs 56.7 per capita per month).
- Lakdawala Committee (1993): It made the following suggestions:
- Consumption expenditure should be calculated based on calorie consumption as earlier.
- State specific poverty lines should be constructed and these should be updated using the Consumer Price Index of Industrial Workers (CPI-IW) in urban areas and Consumer Price Index of Agricultural Labour (CPI-AL) in rural areas.
- Tendulkar Committee (2005): It was set up by the Planning Commission to reassess the methods for estimating poverty and submitted its report in December 2009.
- According to the report, the rural poverty headcount ratio for 2004-05 was at 41.8%, urban at 25.7%, and the pan-India poverty rate stood at 37.2%.
- Rangarajan Committee (2012): It was chaired by former Reserve Bank of India governor C. Rangarajan to review the country's poverty measurement methodology.
- It defined poverty as living on less than Rs 47 per day in urban areas and Rs 32 per day in rural areas.
- It estimated that poverty levels were 19% higher in rural areas and 41% higher in urban areas compared to the Tendulkar Committee's estimates.
-
What is the Need of a New Official Poverty Line in India?
- Outdated Data: India's poverty line estimate based on the Tendulkar Committee (2005) is two decades old.
-
Estimating poverty on the basis of this data is a futile exercise and this grossly underestimates poverty.
-
- Inconsistent with Global Data:
- The World Bank's 2022 report says, India saw "an increase of 56 million poor people" in 2020 (at USD 2.15) due to the pandemic.
- Pew Research Institute's March 2021 report said the number of Indian poor increased by 75 million and added that its middle class shrinking by 32 million.
- But India never acknowledged that poverty increased due to the pandemic or due to pre-pandemic economic shocks of demonetisation of 2016 and GST of 2017.
- Less Realistic Data:
-
The poverty threshold varies from state to state according to people’s social and economic conditions but the current poverty estimation is based on rural, urban and pan-India level.
- This data is less realistic due to inadequate customised measurement and inconsistent data collection methods.
-
- Accuracy Issues:
- There is a lack of comprehensive consumption and inflation data making it impossible to get an accurate picture.
- Indian authorities do not provide inflation data segmented by household income.
- Multidimensional poverty Index (MDPI) evaluates health, education and standard of living across 12 indicators. It relies more on survey-based data rather than actual consumption metrics.
- There is a lack of comprehensive consumption and inflation data making it impossible to get an accurate picture.
- Institutional Issues:
- India’s statistical system, which was applauded globally in the early 1950s, had been criticised by people outside as well as inside the government system in recent times.
- The Ministry of Statistics and Programme Implementation has failed to provide empirical data and struggled to effectively communicate its actions to the relevant stakeholders.
- Example: The findings of the Consumption Expenditure Survey 2017-18 were so abysmal that they were withdrawn by the government.
Government Initiatives to Alleviate Poverty
What is the Status of Inequality in India?
- About:
- In the economy, inequality is the unequal distribution of income and opportunity between different groups in society.
- Income Inequality refers to the extent to which income is evenly distributed within a population.
- Inequality Estimation in India:
- Ways to measure inequality:
- The Gini coefficient (Gini index or Gini ratio) is a measure of income inequality, wealth inequality, or consumption inequality within a nation or a social group.
- A Gini index of 0 represents perfect equality, while an index of 1 implies perfect inequality.
- The Gini coefficient (Gini index or Gini ratio) is a measure of income inequality, wealth inequality, or consumption inequality within a nation or a social group.
- Inequality in India:
-
As per the Household Consumption Expenditure Survey 2022-23, the value of the Gini coefficient for consumption expenditure decreased from 0.283 in 2011-12 to 0.266 for rural areas, and from 0.363 to 0.314 for urban areas in 2022-23.
-
- Ways to measure inequality:
Is a low Gini coefficient Good?
- Generally, developed countries tend to have lower Gini coefficients (e.g., below 0.30), indicating relatively lower income or wealth inequality.
- The Gini Coefficient of developing countries like India tends to be higher. As economies grow and prosper, inequalities widen a bit.
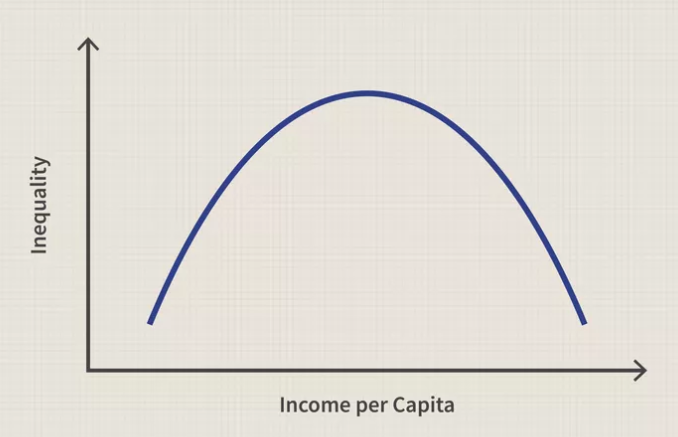
Kuznets curve
- The Kuznets curve is a graphical representation of the relationship between economic development and income inequality.
- It suggests that as an economy develops from a low-income agrarian society to a higher-income industrial and then post-industrial society, income inequality follows a specific pattern.
- The Kuznets curve is often depicted as an inverted U-shaped curve.
- Specific pattern of income inequality:
- Low-Income Stage (Agrarian Economy): At the initial stage of economic development, when a society is primarily agrarian, income inequality tends to be relatively low.
- High-Income Stage (Industrialization): As the economy develops and transitions into an industrial phase, income inequality rises during this phase.
-
High-Income Stage (Post-Industrial): In post-industrial societies, there is more emphasis on service industries, education, and technology where income inequality is expected to decline.
Way Forward
- Institutional Reforms:
- Develop a Communication Strategy: Create a comprehensive communication plan to regularly update stakeholders and the public about MoSPI's activities, methodologies, and data.
- Relevant Data: Conduct periodic reviews of data collection methods to ensure they are up-to-date and relevant to current needs.
- Emerging Issues: Expand data collection to cover emerging issues such as digital economy metrics, environmental statistics, and social welfare indicators.
- Align with Global Practices:
- Consultative Committees: Form consultative committees with representatives from academia, industry, and civil society to provide feedback and guidance on statistical methods and data dissemination.
- Public Feedback Mechanisms: Implement mechanisms for public feedback on MoSPI’s publications and activities to ensure continuous improvement.
Conclusion
Poverty and inequality are deeply interconnected issues that affect societies worldwide, hindering social and economic progress. Addressing these challenges requires a multifaceted approach that includes equitable economic policies, access to quality education, healthcare, and social protection. India needs to address data uncertainties by establishing a more accurate and reliable measure of the poverty line and the number of people living in poverty. A revamping of poverty data for equitable distribution of income will be a step in the right direction.
|
Q. Drishti Mains Question: What are the issues involved in estimation of poverty in India? What need to be done for wider acceptance of Indian statistical data? |
UPSC Civil Services Examination, Previous Year Question (PYQ)
Prelims
Q. Increase in absolute and per capita real GNP do not connote a higher level of economic development, if (2018)
(a) industrial output fails to keep pace with agricultural output.
(b) agricultural output fails to keep pace with industrial output.
(c) poverty and unemployment increase.
(d) imports grow faster than exports.
Ans (c)
Q.In a given year in India, official poverty lines are higher in some States than in others because (2019)
(a) poverty rates vary from State to State
(b) price levels vary from State to State
(c) Gross State Product varies from State to State
(d) quality of public distribution varies from State to State
Ans (b)
Q. The Multi-dimensional Poverty Index developed by Oxford Poverty and Human Development Initiative with UNDP support covers which of the following?(2012)
- Deprivation of education, health, assets and services at household level
- Purchasing power parity at national level
- Extent of budget deficit and GDP growth rate at national level
Select the correct answer using the codes given below:
(a) 1 only
(b) 2 and 3 only
(c) 1 and 3 only
(d) 1, 2 and 3
Ans (a)
Mains
Q. Though there have been several different estimates of poverty in India, all indicate reduction in poverty levels over time. Do you agree? Critically examine with reference to urban and rural poverty indicators (2015)


