SBI Reports Decline in Poverty in India | 07 Jan 2025
Why in News?
A recent research report by the State Bank of India (SBI) highlights a remarkable decline in poverty rates across rural and urban India.
- The report attributes this decline to targeted government interventions, enhanced rural infrastructure, and improved consumption patterns among lower-income groups.
What are the Key Findings of the SBI Report?
- Decline in Poverty Rates:
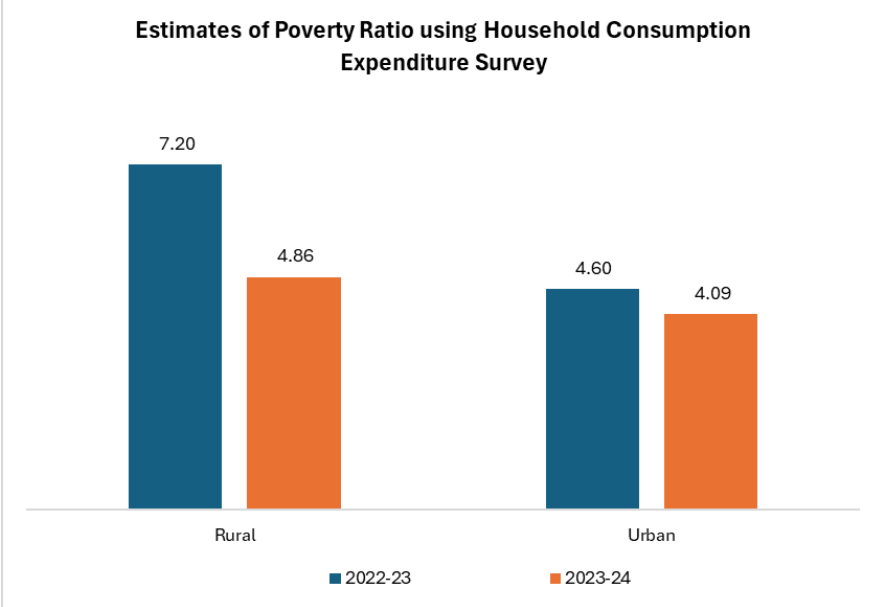
- Rural Poverty: Reduced to 4.86% in FY24 from 25.7% in 2011-12.
- Urban Poverty: Estimated at 4.09% in FY24, down from 13.7% in 2011-12.
- Impact of Government Interventions: Direct Benefit Transfers (DBT), infrastructure development, and farmer-centric initiatives have improved rural livelihoods and reduced consumption inequality.
- Targeted programs addressing income support and social security have significantly benefited lower deciles of income groups.
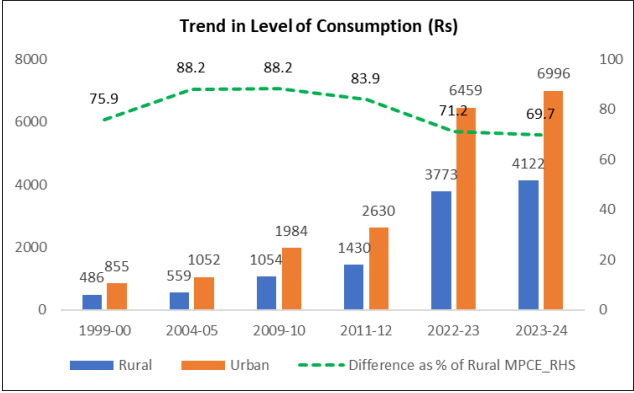
- Improved Consumption in Rural Areas: Rural consumption is growing rapidly and catching up with urban consumption. The rural Monthly Per Capita Consumption Expenditure (MPCE) i.e. difference between urban and rural consumption, measured as a percentage of rural consumption, has been declining.
- It reduced to 69.7% in 2023-24 from 88.2% in 2004-05, showing a narrowing gap between rural and urban spending.

- This has also been supported by data from the latest Household Consumption Expenditure Survey (August 2023–July 2024) which indicated a decreasing gap in MPCE between urban and rural areas from 84% in 2011-12 to 71% in 2022-23, and further to 70% in 2023-24.
- It reduced to 69.7% in 2023-24 from 88.2% in 2004-05, showing a narrowing gap between rural and urban spending.
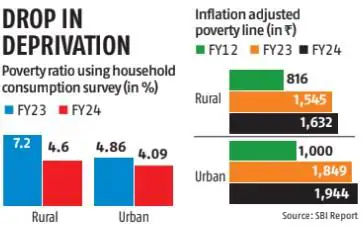
- Poverty Line Definition: The estimated poverty line in FY24 is Rs 1,632 for rural areas and Rs 1,944 for urban areas after adjusting for inflation and imputation factors.
- Earlier, in 2011-12, the Tendulkar Committee had determined the poverty threshold to be Rs 816 for rural regions and Rs 1,000 for urban regions.
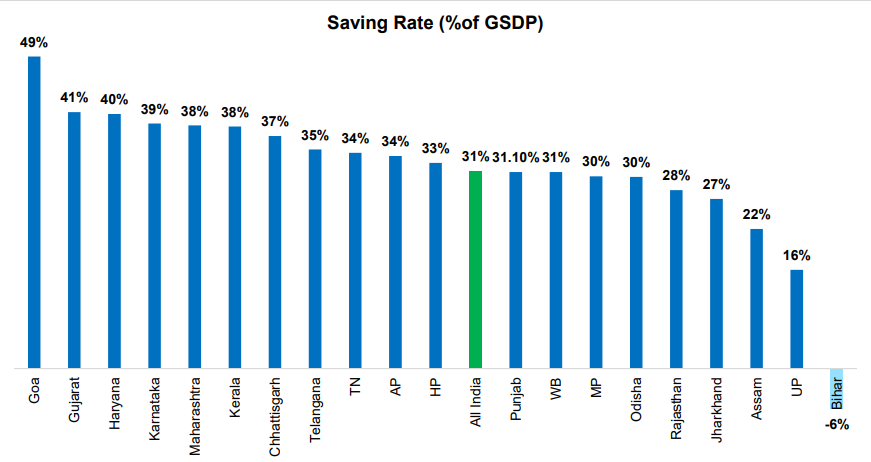
- State-wise Savings: The state-wise savings rate was estimated using MPCE and Per Capita Income, factoring in the rural and urban population distribution.
- States with higher incomes report savings rates above the national average of 31%, indicating stronger financial stability.
- Low-income states like Uttar Pradesh and Bihar show low savings rates which is likely due to high outward migration, which affects income retention and consumption patterns.
- Bihar is the only state showing a negative saving rate at -6%
- There's a significant disparity between the highest (Goa: 49%) and lowest (Bihar: -6%) saving rates.
- Impact of Inflation:
- Elasticity of Consumption Demand:
- Consumption demand is elastic (|e| > 1), meaning that changes in food prices significantly impact overall spending including food expenditures.
- Rising food prices lead to a decrease in MPCE, with the negative elasticity in both low- and high-income states indicating that higher food inflation reduces consumption, in line with the law of demand.
- Rural areas in low-income states are more severely affected by rising food prices, reflecting greater vulnerability.
- In contrast, lower food inflation boosts MPCE in middle-income states, where positive elasticity indicates that reduced food inflation enhances consumption and sustains demand.
- Urban segments of middle-income states show significant increases in MPCE with falling food inflation.
- Regional Disparities:
- The impact of the rural-urban gap is small in low-income states but more noticeable in high-income states.
- This indicates that rural people in low-income states are more cautious about taking risks than those in high-income states.
- Elasticity of Consumption Demand:
Government Initiatives to Alleviate Poverty
UPSC Civil Services Examination, Previous Year Question (PYQ)
Prelims
Q. Increase in absolute and per capita real GNP do not connote a higher level of economic development, if (2018)
(a) industrial output fails to keep pace with agricultural output.
(b) agricultural output fails to keep pace with industrial output.
(c) poverty and unemployment increase.
(d) imports grow faster than exports.
Ans (c)
Q.In a given year in India, official poverty lines are higher in some States than in others because (2019)
(a) poverty rates vary from State to State
(b) price levels vary from State to State
(c) Gross State Product varies from State to State
(d) quality of public distribution varies from State to State
Ans (b)
Q. The Multi-dimensional Poverty Index developed by Oxford Poverty and Human Development Initiative with UNDP support covers which of the following? (2012)
- Deprivation of education, health, assets and services at household level
- Purchasing power parity at national level
- Extent of budget deficit and GDP growth rate at national level
Select the correct answer using the codes given below:
(a) 1 only
(b) 2 and 3 only
(c) 1 and 3 only
(d) 1, 2 and 3
Ans (a)


