Rising Debt Strained Household Savings | 28 May 2024
For Prelims: Household Consumption Expenditure Survey, National Statistical Office, Gross Domestic Product, Consumer Price Inflation, NITI Aayog, Monthly Per Capita Consumer Expenditure, C. Rangarajan Committee.
For Mains: Highlights of the Recent Household Consumption Expenditure Survey
Why in News?
Recently, there has been debate on the issue of drastic fall in Household Net Financial Savings compared to GDP Ratio during 2022-23 due to higher Borrowing to GDP ratio.
- The Chief Economic Advisor (CEA) to the Government of India interpreted this as a mere shift in the composition of household savings, where households incurred greater borrowing (or reduced net financial savings) solely to finance higher physical savings (investment).
- However, some experts disagree. They think there might be bigger economic reasons behind the trend, not just people's spending habits.
Chief Economic Adviser (CEA) to the Government of India
- He advises the government on economic matters and is responsible for the preparation of the Economic survey of India tabled in Parliament before the Union budget of India is presented.
- CEA is head of Economic Division of the Department of Economic Affairs, Ministry of Finance, Government of India
- He holds the rank of a Secretary to the Government of India.
Note
- Household Net Financial Savings: It refers to the portion of household income that is saved and invested in financial assets, such as bank deposits, stocks, bonds, and other financial instruments, after accounting for financial liabilities like loans and mortgages.
- It represents the net change in financial assets held by households over a period.
- Higher Net financial Savings indicates higher economic stability.
- Household Savings to GDP Ratio: The household savings to GDP ratio is the sum of its net financial savings to GDP ratio, physical savings to GDP ratio and gold and ornaments.
- In mathematical expression form: Household Savings=Net Financial Savings+Physical Savings+ (Gold and Ornaments).
What are the Current Changes in the Saving Pattern?
- Increased Borrowing And Asset Stagnation:
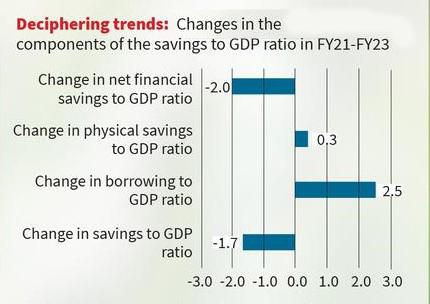
- There has been a greater borrowing (2.5 % points), leading to reduced net financial savings (-2.0% points), but physical savings and investment has not increased much (only 0.3% points).
- This contradicts the government view that greater borrowing (reduced net financial savings) has led to higher physical savings.
- The household savings to GDP ratio declined by 1.7% points while the gold savings to GDP ratio remained largely unchanged.
- There has been a greater borrowing (2.5 % points), leading to reduced net financial savings (-2.0% points), but physical savings and investment has not increased much (only 0.3% points).
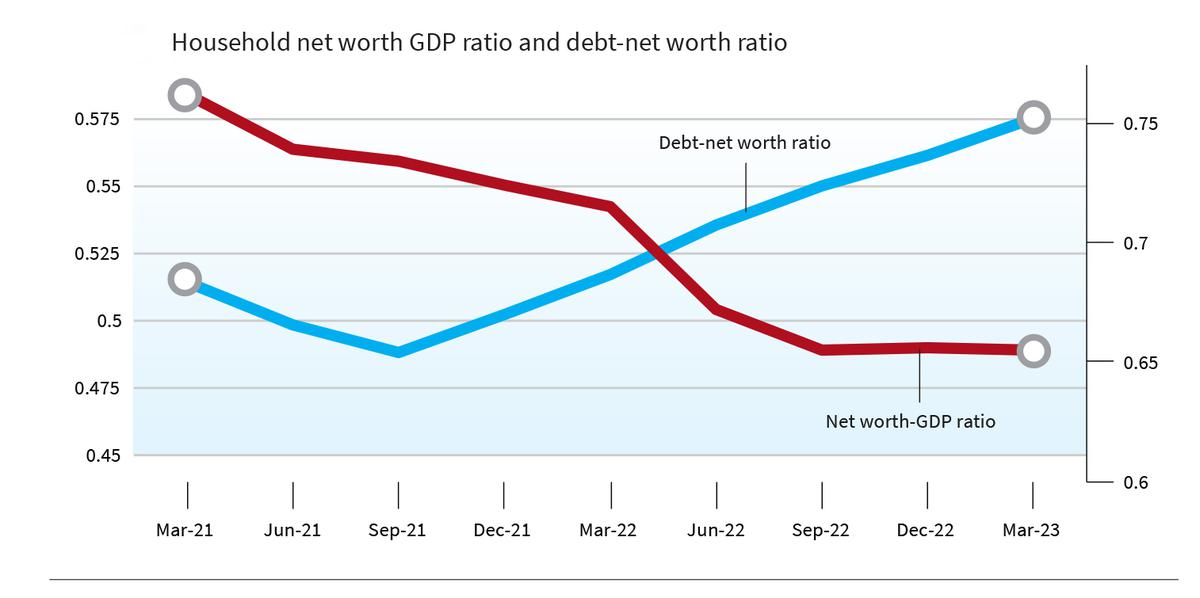
- Decline in Household Financial Wealth to GDP Ratio:
- Households are getting poorer relative to the overall economy, while also borrowing more money. This is because the ratio of household financial wealth to GDP has fallen sharply, while the debt-to-net-worth ratio has risen.
- Rise in Interest Payment Burden: Interest payment burden is the product of interest rate and debt-income (DTI) ratio at a given interest rate.
- The debt-to-income (DTI) ratio is a financial metric that compares an individual's monthly debt payments to their gross monthly income.
- A higher debt-to-income ratio indicates that a person may be at risk of defaulting on their loans, while a lower ratio demonstrates that they have more disposable income to cover their debt obligations.
- The recent period has been associated with a sharp rise in both these variables (DTI and interest payment).
- The debt-income ratio of households can change due to two factors.
- Higher net borrowing-income ratio, where net borrowing is the difference between total borrowing and interest payments.
- Household’s stock of debt would rise at any given level of income if they decide to increase their net borrowing for financing higher investment or consumption.
- Increase in interest rates or reduction in nominal income growth rate.
- If the growth in interest payments outweighs income growth, the debt-income ratio will continue to grow. Such mechanisms can be described as “Fisher dynamics” (phenomenon of rising debt-income ratio in terms of changes in interest rate and nominal income growth rate).
- Higher net borrowing-income ratio, where net borrowing is the difference between total borrowing and interest payments.
- The debt-to-income (DTI) ratio is a financial metric that compares an individual's monthly debt payments to their gross monthly income.
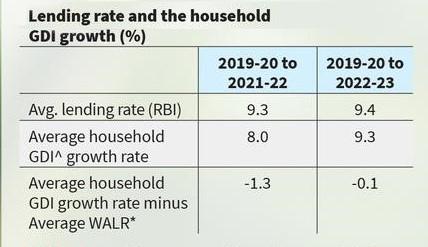
- Household Income Growth Lags Behind Lending Rate:
- For the period 2019-20 to 2022-23, the average value of the growth rate of household disposable income (8% in 2019-20 to 2021-22 and 9.3% in 2019-20 to 2022-23) has been lower than the weighted average lending rate (WALR) (9.3% in 2019-22 and 9.4% in 2019-23).
- The average value of the lending rate for this period is constructed from the Reserve Bank of India’s quarterly figures.
- For the period 2019-20 to 2022-23, the average value of the growth rate of household disposable income (8% in 2019-20 to 2021-22 and 9.3% in 2019-20 to 2022-23) has been lower than the weighted average lending rate (WALR) (9.3% in 2019-22 and 9.4% in 2019-23).
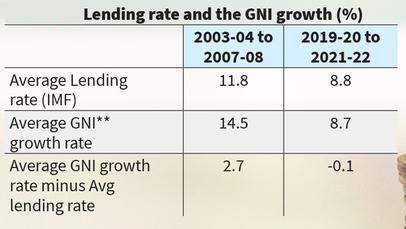
- Decline in Savings and Investment Between 2003-08 and 2019-22:
- From 2003-04 to 2007-08, Average Gross National Income (GNI) growth rate (14.5%) was greater than the average lending rate (11.5%).
- This implied that incomes were growing faster than the cost of borrowing.
- From 2003-04 to 2007-08, Average Gross National Income (GNI) growth rate (14.5%) was greater than the average lending rate (11.5%).
- Fisher Dynamics at Play Since 2019-20:
- It is the phenomenon of rising debt-income ratio due to changes in interest rate and nominal income.
- Since the economic slowdown in 2019-20, the Indian economy has shown signs of Fisher dynamics.
- After, Covid-19 there has been a sharp increase in the amount of debt compared to income for households, mainly due to lower nominal income growth rate.
- With the emergence of the Fisher dynamics, there are 2 unique challenges that confront the Indian economy.
- Increasing Income-Debt Gap: It can lead to higher interest payments for households.
- Reduced Consumption: Higher debt prompts households to cut back on spending. The consumption to GDP ratio dropped in 2023-24, showing this trend.
What are the Macroeconomic Implications of Rising Household Debt Burden?
- Debt repayment: It can become difficult if interest rates rise faster than income growth. This can strain the financial sector as they receive less interest income from households struggling to repay debt. This in turn can lead to reduced credit availability for businesses.
- Consumption Demand: It can also be reduced by high household debt. If households feel financially insecure, they may save more and spend less, slowing down the overall economy.
- Higher Interest Rates to Fight Inflation: If interest rates are raised to combat inflation, this can worsen household debt burdens and push them into a debt trap. This is because higher interest rates will increase the amount of money that households have to pay on their debts.
- Financialisation of the economy: The shift towards financial assets in household balance sheets suggests that the economy is becoming more financialised. This means that a larger share of economic activity is focused on financial markets rather than on the production of goods and services. This can make the economy more fragile and prone to financial crises.
- Financialisation refers to a trend in economies where financial markets take precedence over production, with individuals turning to financial assets like stocks and bonds to accumulate wealth.
Way Forward
- Focus on Income Growth and Debt Control: The gap between interest rates and income growth needs to decrease, and the growth of household debt compared to income needs to slow down.
- Boosting Income Growth: Policies and initiatives that promote job creation, wage increases, and overall economic growth are crucial.
- Managing Debt Levels: Encouraging responsible borrowing practices and potentially regulating excessively high lending rates can help households manage debt more effectively.
- Wage Growth: If wages increase at a pace that outpaces interest rates, households will have more disposable income to manage debt and potentially spend more.
- Debt Management Strategies: Financial education initiatives and responsible lending practices can help households manage debt more effectively, freeing up some income for spending.
|
Drishti Mains Question: Discuss India's decline in household financial wealth and rising borrowing costs. Analyse the potential macroeconomic challenges stemming from this trend and propose policy measures to address them. |
UPSC Civil Services Examination, Previous Year Question:
Q. As per the NSSO 70th Round “Situation Assessment Survey of Agricultural Households”, consider the following statements: (2018)
- Rajasthan has the highest percentage share of agricultural households among its rural households.
- Out of the total agricultural households in the country, a little over 60 percent belong to OBCs.
- In Kerala, a little over 60 percent of agricultural households reported to have received maximum income from sources other than agricultural activities.
Which of the statements given above is/are correct?
(a) 2 and 3 only
(b) 2 only
(c) 1 and 3 only
(d) 1, 2 and 3
Ans: c
2. In a given year in India, official poverty lines are higher in some States than in others because (2019)
(a) poverty rates vary from State to State
(b) price levels vary from State to State
(c) Gross State Product varies from State to State
(d) quality of public distribution varies from State to State
Ans: (b)