Household Consumption Expenditure Survey 2022-23 | 10 Jun 2024
For Prelims: Household Consumption Expenditure Survey, National Statistical Office, Gross Domestic Product, Consumer Price Index, NITI Aayog, Monthly Per Capita Consumer Expenditure, C. Rangarajan Committee.
For Mains: Highlights of the Recent Household Consumption Expenditure Survey
Why in News?
Recently, the detailed report of Household Consumption Expenditure Survey (HCES) 2022-23 was released by Ministry of Statistics and Programme Implementation (MoSPI).
- It provided valuable insights into the spending habits of rural and urban households across different states.
What is the Household Consumption Expenditure Survey?
- About:
- The HCES is conducted by the National Statistical Office (NSO) every 5 years.
- It is designed to collect information on the consumption of goods and services by households.
- The data collected in HCES is also utilised for deriving various other macroeconomic indicators such as Gross Domestic Product (GDP), poverty rates, and Consumer Price Index (CPI).
- The average MPCE has been calculated at 2011-12 prices.
- The survey covered the whole of the Indian Union except a few inaccessible villages in the Andaman and Nicobar Islands.
- The findings of the last HCES, conducted in 2017-18 were not released after the government cited “data quality” issues.
- Information Generated:
- Provides information on the typical spending on both goods (including food and non-food items) and services.
- Additionally, assists in calculating estimates for household Monthly Per Capita Consumer Expenditure (MPCE) and analysing the distribution of households and individuals across different MPCE categories.
What are the Highlights of the Recent Household Consumption Expenditure Survey?
- Food Expenditure Preferences:
- Beverages, Refreshments, and Processed Food: This category was the most significant part of the food expenditure across many states, particularly noticeable in Tamil Nadu with the highest spending percentages both in rural (28.4%) and urban (33.7%) areas.
- Milk and Milk Products: Predominantly favoured in rural and urban households of northern states like Haryana (rural 41.7%, urban 33.1%) and Rajasthan (urban 33.2%).
- Egg, Fish, and Meat: Kerala households showed the highest expenditure in this category, both in rural (23.5%) and urban (19.8%) setups.
- Overall Food vs. Non-Food Expenditure:
- Food Expenditure: In rural India, food constitutes about 46% of total household consumption expenditure, whereas in urban areas, it is around 39%.
- Non-Food Expenditure: There has been a significant shift towards higher spending on non-food items, with rural spending on non-food items rising from 40.6% in 1999 to 53.62% in 2022-23 and urban spending from 51.94% to 60.83% in the same period.
- Major Non-Food Expenditure Categories:
- Conveyance: Remained the top non-food expenditure in both rural and urban settings, with the highest percentages in Kerala.
- Medical Expenses: Particularly high in Kerala, West Bengal, and Andhra Pradesh for rural areas and West Bengal, Kerala, and Punjab for urban areas.
- Durable Goods: The highest expenditure on durable goods was noted in Kerala in both rural and urban areas.
- Fuel and Light: West Bengal and Odisha showed significant spending in rural and urban settings, respectively.
- Regional Variations:
- Different states showed varying preferences for spending on specific food and non-food items, reflecting cultural and regional economic differences.
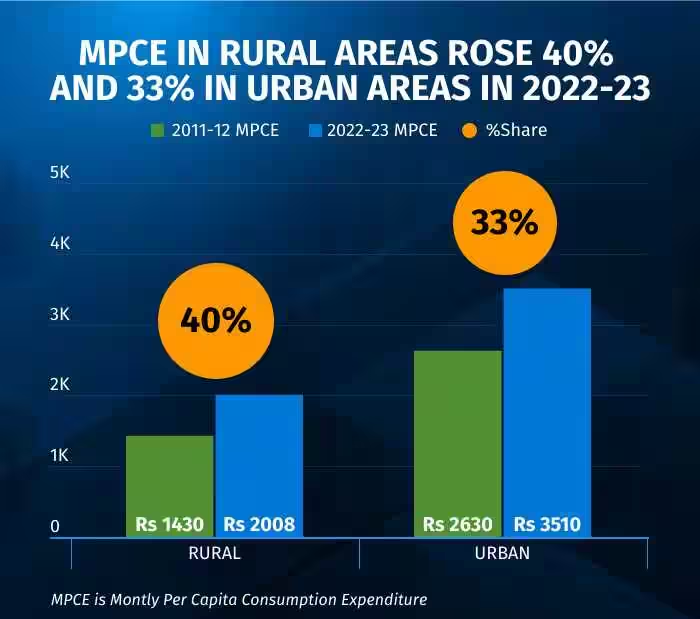
- Growth in Consumption Expenditure:
- The survey indicates a substantial increase in consumption expenditure over the past decade. Rural monthly consumption per person increased by 164% from 2011-12 to 2022-23, while urban monthly consumption per person grew by 146%.
- The rural monthly per capita consumption has seen a faster growth when compared to the urban sector in India.
- The difference between the urban and rural MPCE has seen a decrease over the years, with the differential reducing from 90 percent in 2009-10 to 75 percent in 2022-23.
National Statistical Office
- About: Formed in 2019 by merging the Central Statistical Office (CSO) and the National Sample Survey Office (NSSO).
- C. Rangarajan Committee first suggested the establishment of NSO as the nodal body for all core statistical activities.
- It currently works under the Ministry of Statistics and Programme Implementation (MoSPI).
- Function: Collects, compiles, and disseminates reliable, objective, and relevant statistical data.
|
Drishti Mains Question: Q. In the light of, Household Consumption Expenditure Survey (HCES) 2022-23 examine the potential implications of changing consumption patterns on India's economic planning and development strategies. |
UPSC Civil Services Examination, Previous Year Question (PYQ)
Prelims:
Q. As per the NSSO 70th Round “Situation Assessment Survey of Agricultural Households”, consider the following statements: (2018)
- Rajasthan has the highest percentage share of agricultural households among its rural households.
- Out of the total agricultural households in the country, a little over 60 percent belong to OBCs.
- In Kerala, a little over 60 percent of agricultural households reported to have received maximum income from sources other than agricultural activities.
Which of the statements given above is/are correct?
(a) 2 and 3 only
(b) 2 only
(c) 1 and 3 only
(d) 1, 2 and 3
Ans: c
Q. In a given year in India, official poverty lines are higher in some States than in others because (2019)
(a) poverty rates vary from State to State
(b) price levels vary from State to State
(c) Gross State Product varies from State to State
(d) quality of public distribution varies from State to State
Ans: (b)