Consumption Comparison of India-China | 23 May 2024
For Prelims: International Monetary Fund (IMF), Gross Domestic Product (GDP) Ratio, Fertility Rate.
For Mains: Differences Between the Economies of India and China, Steps that Can be Taken to Improve the Indian Economy
Why in News?
In 2023, India became the world's most populous country (with a population of around 1.44 Billion), surpassing China. It has significant consequences on domestic consumption in the two countries.
- This was due to China's declining birth rate (6.4 births per 1,000 people) and total fertility rate (~1%), leading to a negative population growth rate for the first time in six decades. As a result, China is facing a rising dependency ratio.
- In contrast, India's population is expected to continue growing and reach its peak around 2060, despite reaching replacement levels with a total fertility rate of 2.1.
United Nations Department of Economic and Social Affairs (UNDESA)
- It was formed in 1948. It is a pioneer of the Sustainable Development Goals (SDGs).
- It brings the global community together to work towards common solutions to the world’s most pressing problems.
- It helps countries translate their global commitments into national action in the economic, social and environmental spheres.
Key Terms:
- Birth Rate: It is a demographic measure that indicates the number of live births occurring during a given year per 1,000 people in a population.
- Total Fertility Rate (TFR): It is the average number of children a woman would be expected to have over her lifetime, given current age-specific fertility rates.
- Unlike the birth rate, which is a measure of births per 1,000 people in a population per year, the TFR provides a broader perspective on reproductive behaviour and potential population growth.
- Dependency Ratio: It compares the proportion of individuals who are typically not in the labour force (dependents) to those who are usually in the labour force (the working-age population).
- Replacement Level Fertility: It refers to the number of children a woman needs to have in order to replace herself and her partner, ensuring that the population size remains stable from one generation to the next, without considering migration.
- The commonly cited figure for replacement level fertility is approximately 2.1 children per woman.
What are the the Consumption Comparison Between Indian and China?
- Consumer Size:
- Both India and China have a large consumer base. A consumer is anyone who spends more than USD12 a day, as per the Purchasing Power Parity (PPP).
.png)
- Addition to Consumer Base:
- According to the World Data Bank, China's consumer base increased by 31 million in 2024, whereas India saw an addition of 33 million consumers.
- Projections for 2025 suggest that China will add 32 million consumers, while India is expected to add 34 million.
- Private Final Consumption Expenditure (PFCE): It contributes more than 58% to India’s GDP, while it contributes only 38% to China’s economy.
- PFCE is a major component of India’s Gross Domestic Product (GDP) and reflects consumer spending, which is a critical driver of economic activity.
- PFCE is a key economic indicator that measures the total value of all goods and services consumed by households and non-profit institutions serving households (NPISHs) within a country during a specific period.
- NPISHs are organisations that provide non-commercial services to individuals and families. Examples include religious institutions, charities, and social clubs.
- Final consumption, including government consumption expenditure, constitutes 68% of India's GDP and 53% of China's GDP.
- This implies that the government is a much bigger consumer in China than in India.
- Final Consumption Expenditure (FCE) is obtained by adding Government Expenditure and Private Final Consumption Expenditure (PFCE).
- The percentage of consumption expenditure is steadily increasing in India, while it has been on a decline in China.
- Differences in Consumption Patterns and Economic Development: India spends a higher proportion of their income on consumption.
- China's economic size (USD17.8 trillion) is around 5 times that of India's (USD 3.5 trillion) in Nominal terms and PPP terms, China’s GDP is approximately 2.5 times of India’s.
- In Nominal terms, China’s PFCE (USD 6.6 trillion) is only about 3.5 times higher than India's(USD 2.1 trillion) and in PPP terms, China’s PFCE is approximately 1.5 times that of India.
- Thus, consumption plays a more significant role in India's GDP compared to China.
- India will reach the same level of consumption as China at a much lower GDP figure (around USD 10 trillion for India compared to USD 17 trillion for China in nominal terms).
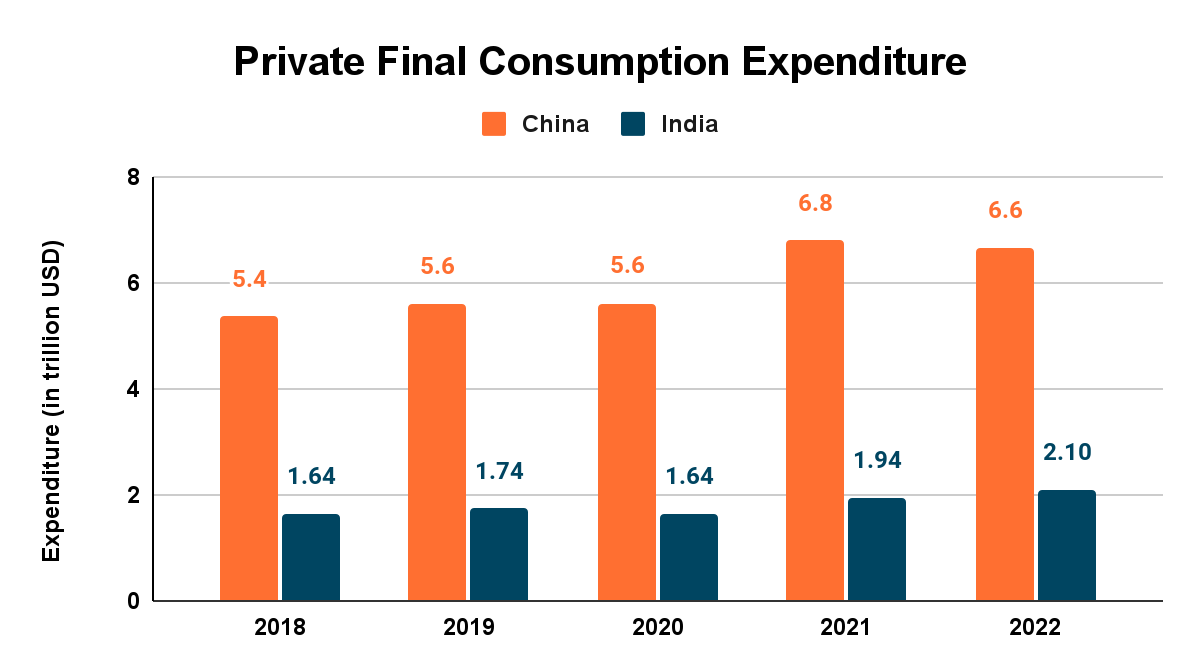
- PFCE Trends between 2018 and 2022:
- China's consumer spending has grown significantly in the past four years (USD 5.4 trillion in 2018 to USD 6.6 trillion in 2022), despite concerns.
- On the other hand, India’s figures have steadily increased from USD 1.64 trillion in 2018 to USD 2.10 trillion in 2022.
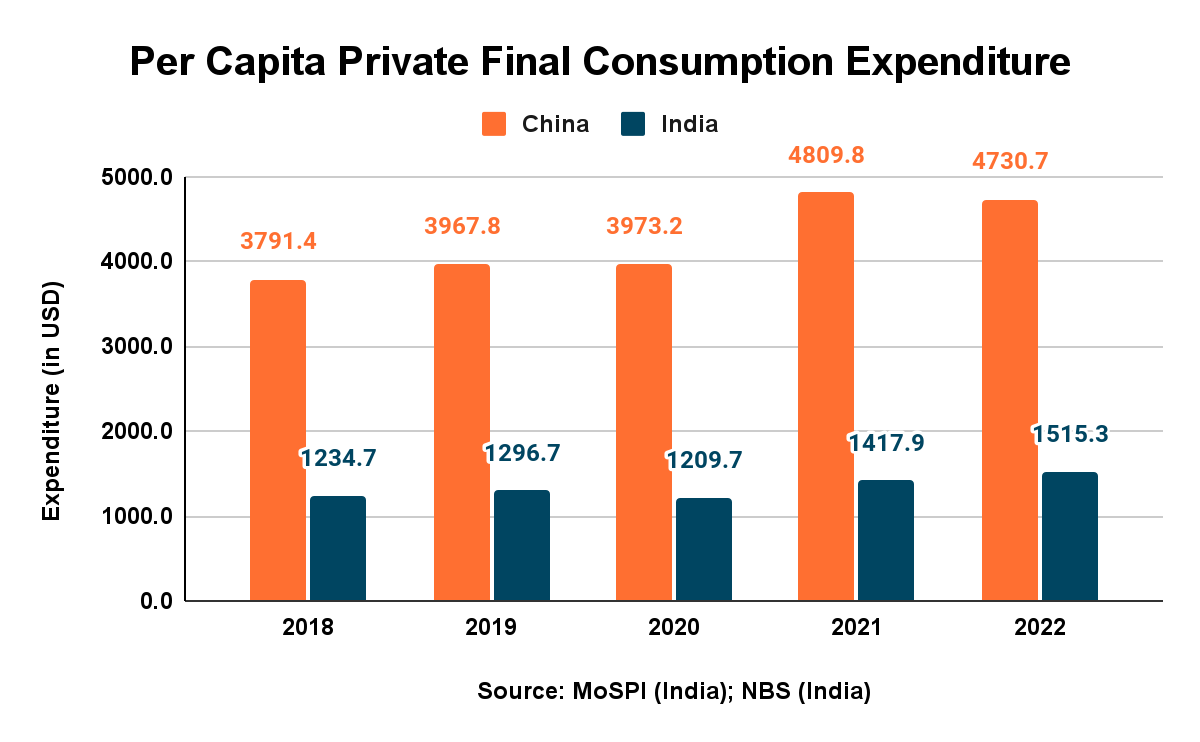
- In 2022, China's spending went down slightly, both overall (from USD6.8 trillion to USD6.6 trillion) and per person (from USD 4,809 to USD 4,730). Meanwhile, India's spending inched up in both categories.
- The difference in the expenditure between the two countries has widened from USD 3.8 trillion in 2018 to more than USD 4.5 trillion in 2022.
- China's consumer spending has grown significantly in the past four years (USD 5.4 trillion in 2018 to USD 6.6 trillion in 2022), despite concerns.
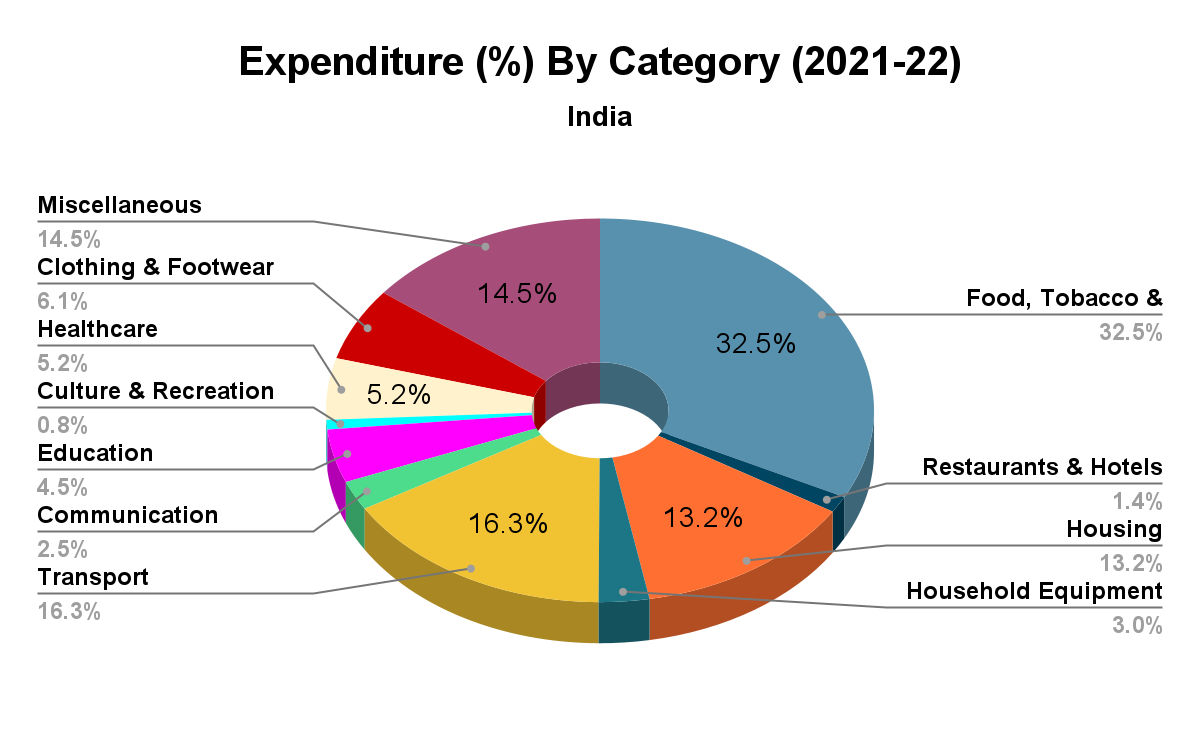
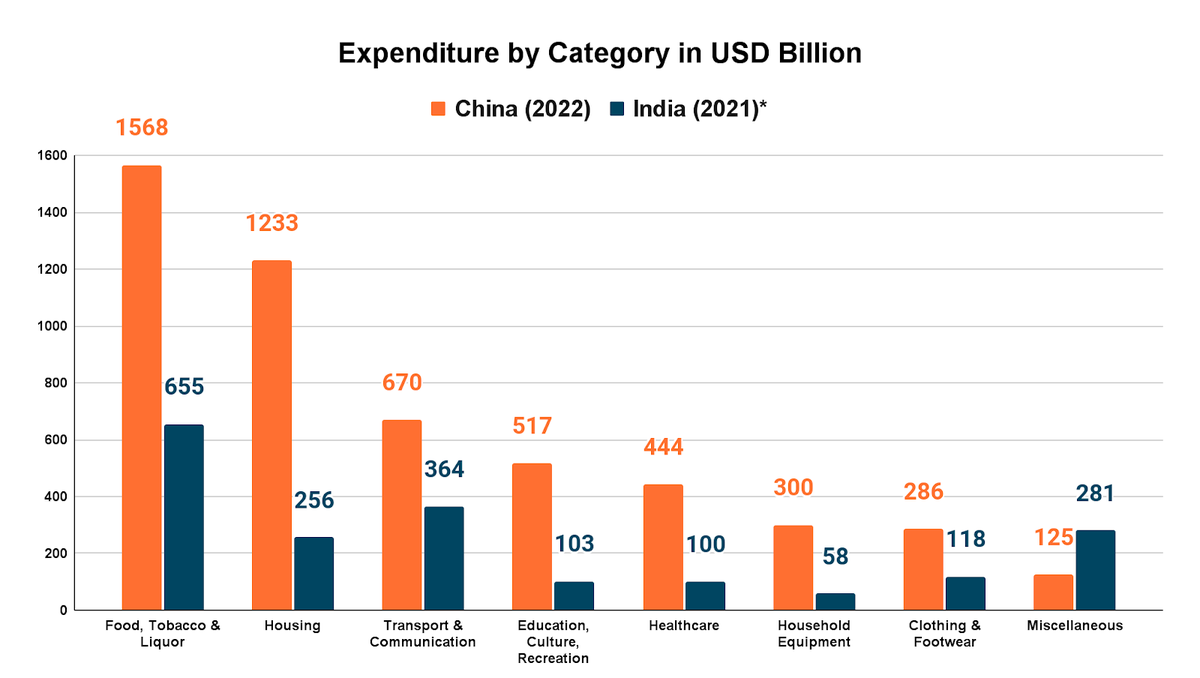
- Expenditure by Categories:
- Indian consumers allocate a larger portion of their spending towards basic needs like food, clothing, footwear, and transportation.
- This spending pattern reflects a developing economy where households prioritise necessities over discretionary spending.
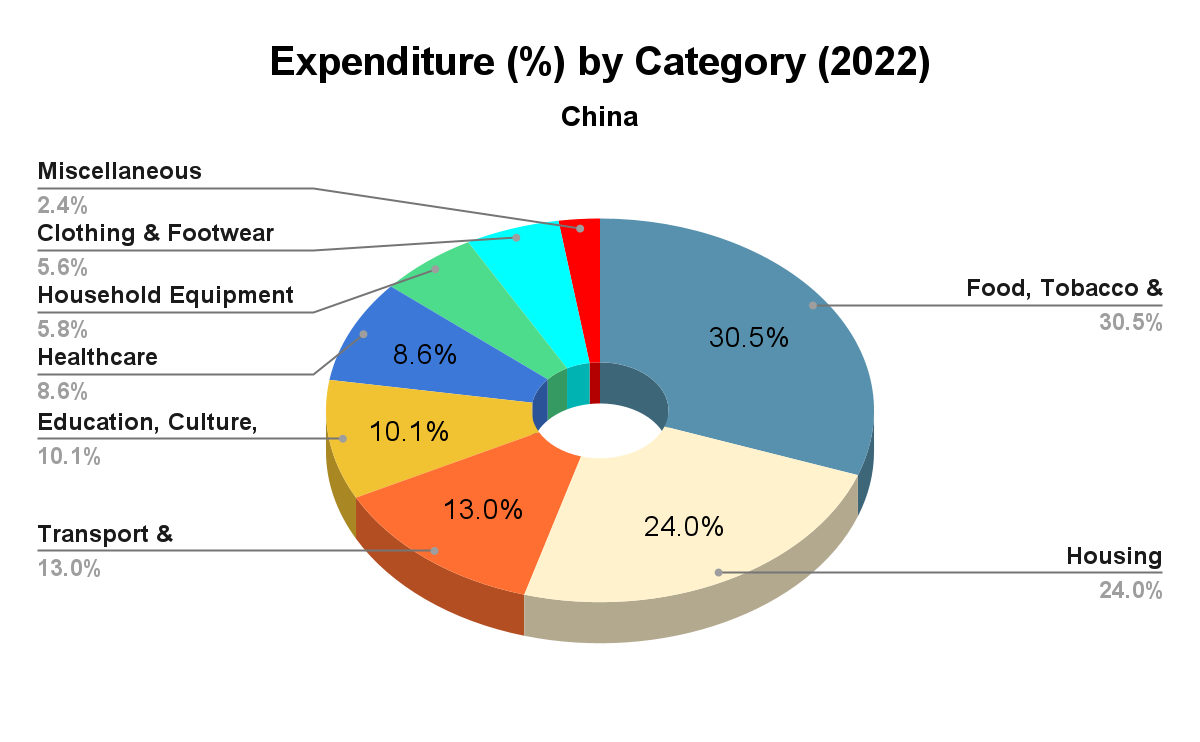
- On the contrary, China's consumption basket reflects a market that is relatively advanced.
- While food and beverages make up the largest portion of China's consumption, their share of total consumption expenditure is decreasing, indicating a market that is becoming more mature.
- Also, it spends a larger proportion of its budget on housing, white goods, recreation, education, and healthcare compared to India.
- In advanced economies like the US, Japan, EU, Germany, and the UK, food expenditure is not the highest category.
- India spends about half as much as China on food, transport, communication, and clothing. Even though India's economy is only one-fifth the size of China's, the total expenditure in these sectors represents a similar percentage of their respective economies.
- As per Monthly Per Capita Consumption Expenditure (MPCE) report, both in rural and urban areas of India, the share of food in total expenses reduced and that in non-food expenses increased in 2022-23 compared with 2011-12.
- Indian consumers allocate a larger portion of their spending towards basic needs like food, clothing, footwear, and transportation.
What are the Factors Responsible for Difference in Consumption Pattern between India and China?
- Demographic Dividend:
- According to the World Bank Report, as of 2022, the median age in India is 28.4 years compared to China's 38.4 years.
- A younger population is likely in its early career stages, with rising income and a greater tendency to spend on establishing a household (housing, durables, transportation).
- According to the World Bank Report, as of 2022, the median age in India is 28.4 years compared to China's 38.4 years.
- Income Levels and Disposable Income:
- China has a larger and more established middle class with higher disposable incomes, enabling greater spending beyond essentials.
- In contrast, India's middle class is smaller, with more income directed towards basic necessities like food and transportation, resulting in less discretionary spending.
- Gross National Income(GNI) per capita in China for the year 2022 was USD 12,8501 and in India USD 2,5473.
- Stage of Economic Development:
- India is categorised as a Lower-middle-income country and China as an upper-middle-income country according to the World Bank .
- China's economy has transitioned from agriculture to manufacturing and then to services, driven by rapid industrialization, export-oriented growth, and infrastructure investment.
- India has moved more directly from agriculture to services, with significant growth in IT, finance, and professional services, while its manufacturing sector is still developing.
- Access to Credit:
- According to World Bank data, China has a much higher level of credit penetration compared to India.
- Nearly half of the adult population in China has a credit card, while only around 12% do in India.
- A significantly larger portion of the Chinese population (over 85%) has access to loans from financial institutions compared to India (around 57%).
- According to World Bank data, China has a much higher level of credit penetration compared to India.
- Urbanisation:
- While urbanisation is increasing in India, it lags behind China. This limits the reach of discretionary products and keeps consumption patterns focused on necessities.
- In 2020, 63.8% of China's population was urban, compared to 34.5% of India's population, according to the World Bank.
|
Drishti Mains Question: Analyse the consumption patterns between India and China. Discuss the factors that have influenced these patterns and assess their implications for economic development of India. |
UPSC Civil Services Examination, Previous Year Question:
Q. As per the NSSO 70th Round “Situation Assessment Survey of Agricultural Households”, consider the following statements: (2018)
- Rajasthan has the highest percentage share of agricultural households among its rural households.
- Out of the total agricultural households in the country, a little over 60 percent belong to OBCs.
- In Kerala, a little over 60 percent of agricultural households reported to have received maximum income from sources other than agricultural activities.
Which of the statements given above is/are correct?
(a) 2 and 3 only
(b) 2 only
(c) 1 and 3 only
(d) 1, 2 and 3
Ans: (c)
Q. In a given year in India, official poverty lines are higher in some States than in others because (2019)
(a) poverty rates vary from State to State
(b) price levels vary from State to State
(c) Gross State Product varies from State to State
(d) quality of public distribution varies from State to State
Ans: (b)