Economic Trajectory | 18 Sep 2024
Why in News?
Recently, the Economic Advisory Council to the Prime Minister (EAC-PM) report revealed the economic dominance of five states in India during the 1960s.
Key Points
- In the 1960s, five states, Uttar Pradesh, Maharashtra, West Bengal, Tamil Nadu, and Bihar, accounted for approximately 54% of India’s Gross Domestic Product (GDP).
- Uttar Pradesh (then undivided) was the largest economic contributor among these states, contributing 14.4% of India’s total GDP.
- Uttar Pradesh’s Economy:
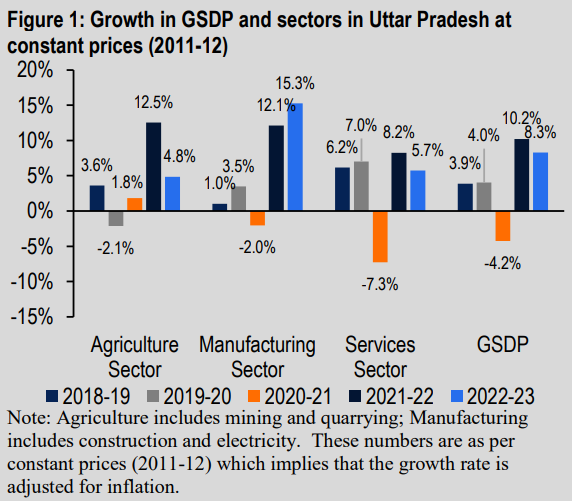
- Gross State Domestic Product (GSDP) Growth:
- In 2022-23, Uttar Pradesh’s GSDP (at constant prices) grew by 8.3%, down from 10.2% in 2021-22.
- National GDP is estimated to grow at 7.2% in 2022-23.
- Sectoral Growth:
- Agriculture sector: Grew by 10% in 2022-23 (at current prices), compared to 14% in 2021-22 (growth in 2021-22 was over a low base).
- Manufacturing sector: Grew by 22% in 2022-23.
- Services sector: Grew by 12% in 2022-23.
- Contributions to the economy (at constant prices): Agriculture (24%), Manufacturing (30%), Services (46%).
- Per Capita GSDP:
- Estimated at Rs 96,193 in 2022-23 (at current prices), with an annual growth of 8% since 2017-18.
- Gross State Domestic Product (GSDP) Growth:
- The GSDP growth rates at constant prices of 2011-12 were: 4.7% (2012-13), 5.8% (2013-14), 4.0% (2014-15), 8.8% (2015-16), 11.4% (2016-17), 4.6% (2017-18), 6.3% (2018-19), 3.8% (2019-20), -5.5% (2020-21), and 4.2% (2021-22).
- Share of UP in National GDP: The share of Uttar Pradesh (UP) in the national GDP is either constant or declining. For a trillion-dollar economy, UP's share should increase to 20%.
- The GDP of India at current prices increased from Rs.153.92 lakh crore in 2016-17 to Rs.236.64 lakh crore in 2021-22.
- The share of Uttar Pradesh (UP) in India's GDP declined from 8.4% in 2016-17 to 7.9% in 2021-22.
- Widening Per Capita Income Gap: The gap between per capita income of India and UP has widened over the years. In 2011-12, UP's per capita income was about 50% of India's, but by 2021-22, it had decreased to 45.87%. This indicates that UP has not kept pace with national economic growth.
- The projected GSDP in 2026-27 under alternative growth scenarios arranged in points:
- Very High (CAGR = 20%): Rs.42.5 lakh crore
- High (CAGR = 15%): Rs.35.8 lakh crore
- Moderate (CAGR = 12%): Rs.32.2 lakh crore
- Normal (CAGR = 10%): Rs.30 lakh crore
Economic Advisory Council to the Prime Minister (EAC-PM)
- It is an non-constitutional, non-statutory, independent body constituted to give advice on economic and related issues to the Government of India, specifically to the Prime Minister.
- The council serves to highlight key economic issues to the government of India from a neutral viewpoint.
- It advises the Prime Minister on economic issues like inflation, microfinance, and industrial output.
- For administrative, logistic, planning and budgeting purposes, the NITI Aayog serves as the Nodal Agency for the EAC-PM.
- Periodic Reports:
- Annual Economic Outlook.
- Review of the Economy.