Day 36: Section- I
1. Write short answer of the following questions:
(a) The contribution of Bihar in the Individual Satyagraha movement. (7 marks)
(b) The Government of India Act of 1935. (8 marks)
(c) Madhubani painting. (7 marks)
(d) Cause of the Santhal revolt. (8 marks)
(e) Contribution of Jayprakash Narayan in the freedom struggle of India. (8 marks)
2. (a) What were the key causes and consequences of the Birsa Munda movement? How did it influence the trajectory of tribal rights and social movements in India? (38 marks)
Or
(b) Discuss the role and contributions of Bihar in the Quit India Movement during India's struggle for independence. (38 marks)
or
3. (a) Analyze the significance of the Champaran Satyagraha in India's freedom struggle. Discuss its impact on the Indian peasants and its contribution to the evolution of Mahatma Gandhi's leadership in the independence movement. (38 Marks)
Or
(b) Examine the causes of the 1857 Rebellion and discuss the role and contributions of Bihar in the uprising. How did Bihar's participation shape the course of the rebellion and influence India's struggle for independence? (38 Marks)
Section- II
4. Write short answer of the following questions:
(a) Explain the key features and objectives of Atal Innovation Mission 2.0. (7 marks)
(b) Examine the current status and potential of renewable energy in Bihar. (8 marks)
(c) Discuss the role and significance of the International Solar Alliance (ISA) in promoting global solar energy adoption. (7 marks)
(d) Analyze the major agenda and outcomes from the UN Climate Change Conference (UNFCCC COP 29). (8 marks)
(e) Evaluate the Supreme Court guidelines on property demolition in the context of due process and rule of law. (8 marks)
5. (a) Analyze the role of BRICS in global governance. Discuss the economic, political, and strategic significance of the BRICS countries in addressing contemporary global challenges.
(38 Marks)
Or
(b) In the context of recent debates surrounding the Uniform Civil Code (UCC) in India, analyze its implications for national integration, gender justice, and the protection of cultural diversity. Discuss the challenges and potential benefits of its implementation in the current socio-political landscape. (38 Marks)
6. (a) Critically analyze the current state of India-China relations, focusing on the strategic, economic, and border issues. What are the challenges and opportunities in maintaining a stable bilateral relationship between the two countries? (38 Marks)
Or
(b) Analyze the impact of the U.S. presidential election on India’s foreign policy and bilateral relations with the United States. Discuss the potential changes in trade, defense cooperation, and regional security dynamics under different U.S. administrations. (38 Marks)
Section- III
7. Study the following graph carefully and answer the questions given below:
(a) Find the difference between targeted result and actual result for the years 2015-2016, 2016-2017, 2019-2020 and 2020-2021 taken together. (6 marks)
(b) Find the ratio of the sum of targeted results for the year 2015-2016, 2017-2018 and 2018-2019 to the sum of actual results for the year 2015-2016, 2017-2018 and 2018-2019.
(6 marks)
(c) What is the ratio of the number of years in which the actual result was above the average actual result to the number of years in which the actual result was below the average actual result? (6 marks)
(d) In which period was the percentage of actual result with respect to target result the maximum and minimum? (6 marks)
(e) What is the percentage change in the targeted result from 2018-2019 to 2019- 2020? (6 marks)
(f) Which year has maximum actual and target results and how much? (6 marks)
Or
The following charts depict the distribution of overseas tourists from India to various countries and also the age distribution of tourists from India during the year 2017:
(a) If amongst the European Union, Switzerland accounts for 25% of tourists traffic and it is known from official Swiss records that a total of 4 lakh Indian tourists visited Switzerland during the year 2017, then how many total number of Indian tourists in the age group of 40-49 years went abroad from India during the year 2017? (7 marks)
(b) If the total number of tourists of age group 30–49 is 2400000, what is the number of tourists who are more than 60 years of age? (7 marks)
(c) If the total number of Indian tourists who went to China more than 40 years of age, was 360000 and constituted 30% of total tourists to China, then how many tourists of other age groups went to China? (8 marks)
(d) Assuming that the total number of tourists from India going abroad increased by 20% in the year 2018, what will be the total number of tourists in age group less than 30 in the year 2018?
(7 marks)
(e) If per capita spending per day of tourists in the UK is ₹6,000 and that in USA is ₹5,000 and it is known that 3200000 tourists visited these two countries, what was the total spending of the tourists in these countries? (7 marks)
8. Study the following Pie-Chart where Chart-I shows the share of production of various car companies in the year 2022-23 and Chart-II shows the total production of cars for various annual years.
(a) How many cars did Kia and Suzuki produce in the year 2022-23? (7 marks)
(b) What are the average sales of Mercedes, Bentely and Royce Rolls in the year 2022-23.
(7 marks)
(c) What is the difference between the car production of Tata in the year 2022-23 as compared to Kia? (7 marks)
(d) Find the percentage of cars produced by Toyota company in the year 2022-23 as compared to total car production in the year 2022-23. (7 marks)
(e) As compared to the total car produced by Mercedes in the year 2022-23, the share of Mercedes was 10° less in 2021-22. What is the change in car production by Mercedes?
(8 marks)
Or
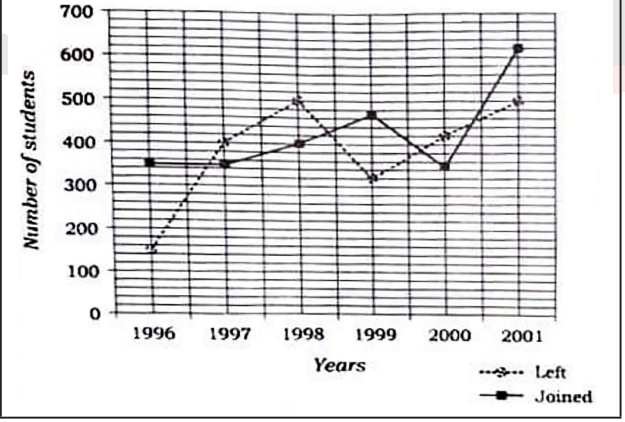
Study the following line graph which gives the number of students who joined and left the school in the beginning of the year for six years from 1996 to 2001. Initial strength of the school in 1995 was 3000.
Answer the questions based on the line graph given below:
(a) The number of students studying in the school in 1998 was what percent of the number of students studying in the school in 2001? (7 marks)
(b) Find the ratio of the least number of students who joined the school to the maximum number of students who left the school in any of the years during the given period. (7 marks)
(c) During which year, the percentage increase in the strength of school was minimum?
(8 marks)
(d) What was the percent increase/decrease in the number of students from 1998 to 1999?
(7 marks)
(e) Find the ratio of the maximum number of students who joined the school to the minimum number.
Key points will be uploaded soon
 (a) Find the difference between targeted result and actual result for the years 2015-2016, 2016-2017, 2019-2020 and 2020-2021 taken together. (6 marks)(b) Find the ratio of the sum of targeted results for the year 2015-2016, 2017-2018 and 2018-2019 to the sum of actual results for the year 2015-2016, 2017-2018 and 2018-2019.(6 marks)(c) What is the ratio of the number of years in which the actual result was above the average actual result to the number of years in which the actual result was below the average actual result? (6 marks)(d) In which period was the percentage of actual result with respect to target result the maximum and minimum? (6 marks)(e) What is the percentage change in the targeted result from 2018-2019 to 2019- 2020? (6 marks)(f) Which year has maximum actual and target results and how much? (6 marks)OrThe following charts depict the distribution of overseas tourists from India to various countries and also the age distribution of tourists from India during the year 2017:
 (a) If amongst the European Union, Switzerland accounts for 25% of tourists traffic and it is known from official Swiss records that a total of 4 lakh Indian tourists visited Switzerland during the year 2017, then how many total number of Indian tourists in the age group of 40-49 years went abroad from India during the year 2017? (7 marks)(b) If the total number of tourists of age group 30–49 is 2400000, what is the number of tourists who are more than 60 years of age? (7 marks)(c) If the total number of Indian tourists who went to China more than 40 years of age, was 360000 and constituted 30% of total tourists to China, then how many tourists of other age groups went to China? (8 marks)(d) Assuming that the total number of tourists from India going abroad increased by 20% in the year 2018, what will be the total number of tourists in age group less than 30 in the year 2018?(7 marks)(e) If per capita spending per day of tourists in the UK is ₹6,000 and that in USA is ₹5,000 and it is known that 3200000 tourists visited these two countries, what was the total spending of the tourists in these countries? (7 marks)8. Study the following Pie-Chart where Chart-I shows the share of production of various car companies in the year 2022-23 and Chart-II shows the total production of cars for various annual years.
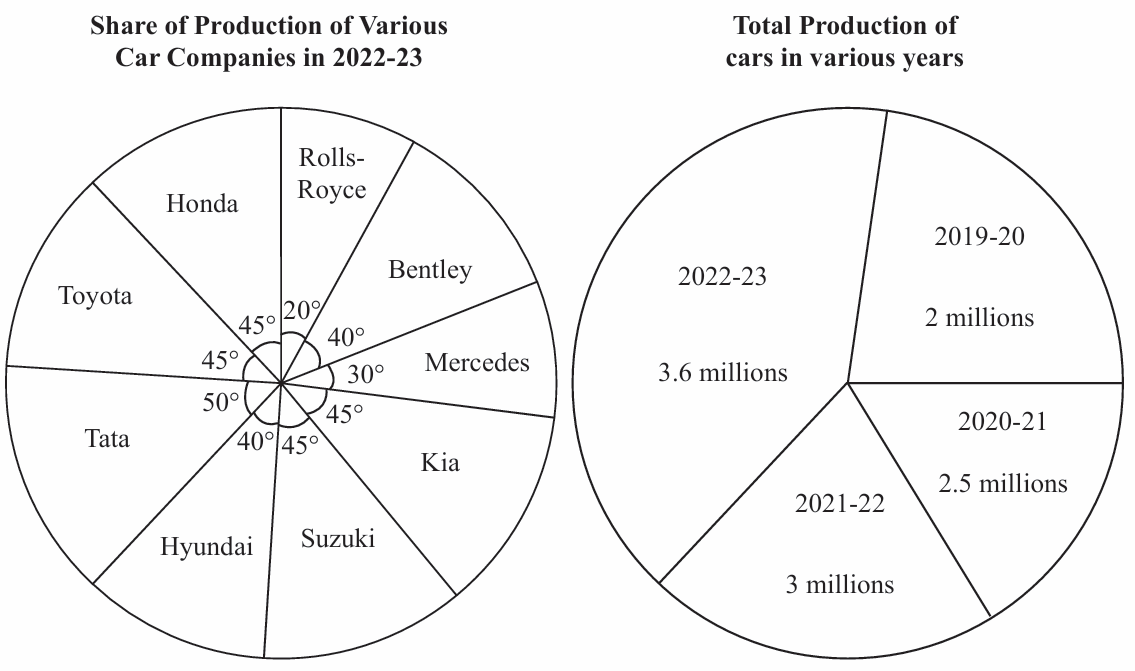 (a) How many cars did Kia and Suzuki produce in the year 2022-23? (7 marks)(b) What are the average sales of Mercedes, Bentely and Royce Rolls in the year 2022-23.(7 marks)(c) What is the difference between the car production of Tata in the year 2022-23 as compared to Kia? (7 marks)(d) Find the percentage of cars produced by Toyota company in the year 2022-23 as compared to total car production in the year 2022-23. (7 marks)(e) As compared to the total car produced by Mercedes in the year 2022-23, the share of Mercedes was 10° less in 2021-22. What is the change in car production by Mercedes?(8 marks)OrStudy the following line graph which gives the number of students who joined and left the school in the beginning of the year for six years from 1996 to 2001. Initial strength of the school in 1995 was 3000.Answer the questions based on the line graph given below:
 (a) The number of students studying in the school in 1998 was what percent of the number of students studying in the school in 2001? (7 marks)(b) Find the ratio of the least number of students who joined the school to the maximum number of students who left the school in any of the years during the given period. (7 marks)(c) During which year, the percentage increase in the strength of school was minimum?(8 marks)(d) What was the percent increase/decrease in the number of students from 1998 to 1999?(7 marks)(e) Find the ratio of the maximum number of students who joined the school to the minimum number.Key points will be uploaded soon