World Poverty Clock | 08 Mar 2024
Why in News?
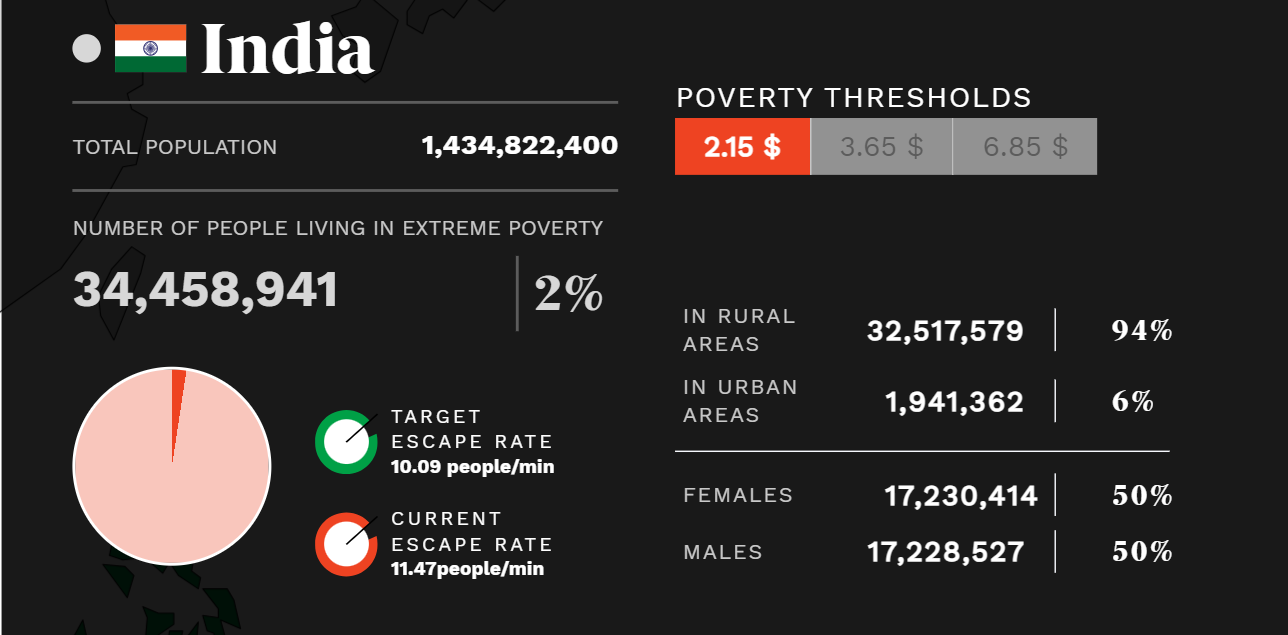
According to the latest data from the World Poverty Clock, India has successfully reduced the proportion of its population living in 'extreme poverty' to below 3%.
- It signifies a substantial step towards accomplishing the first of the 17 Sustainable Development Goals (SDGs) set by the United Nations, with the target year of 2030.
What are the Key Findings of the World Poverty Clock?
- About:
- The World Poverty Clock tracks real-time poverty estimates until 2030 for almost all countries, monitoring progress toward ending extreme poverty.
- The Clock shows the worldwide number of people in extreme poverty, sorting them by age, gender, and rural or urban residency, capturing both those escaping poverty and those falling into it every second.
- The escape rate calculates the current rate of poverty reduction in the world.
- It is backed by the International Fund for Agricultural Development (IFAD) and Germany's Federal Ministry for Economic Cooperation and Development.
- Methodology and Key Findings:
- It computes poverty rates by considering income levels, with the poverty threshold established at USD 2.15 per day.
- The USD 2.15-a-day poverty line, reflecting national poverty lines in some of the poorest countries, is commonly known as the extreme poverty line.
- It is used to monitor progress towards the World Bank's goal of reducing the share of people living in extreme poverty to less than 3% by 2030.
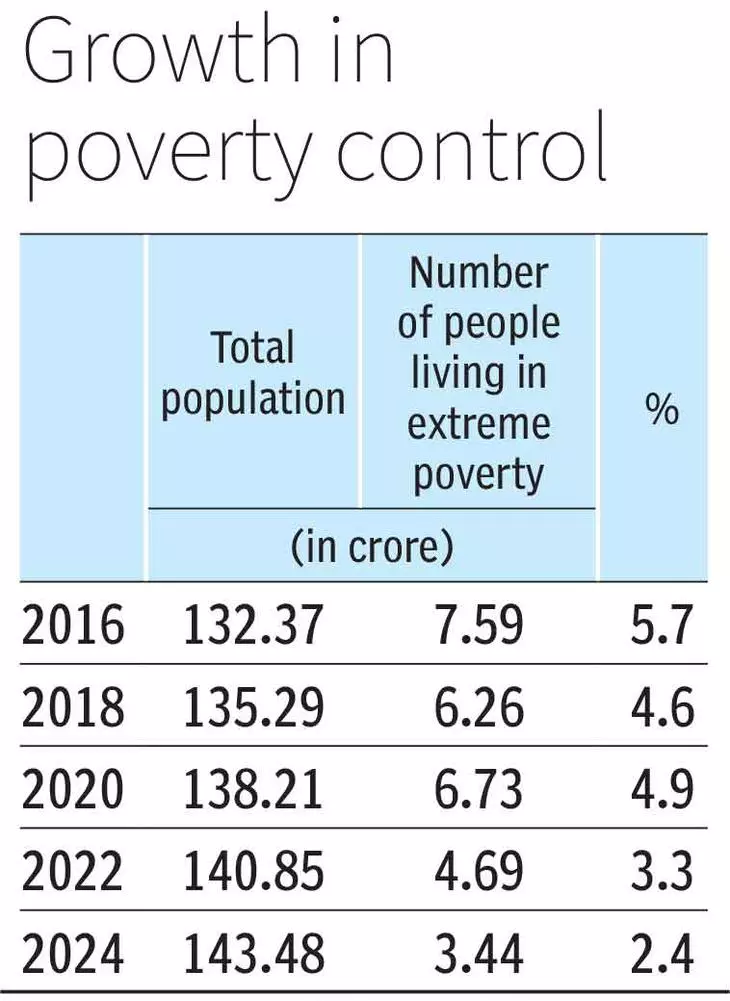
- The population in India experiencing extreme poverty declined to approximately 3.44 crore in 2024 from 4.69 crore in 2022, accounting for 2.4% of the total population.
- These figures confirm a claim by the CEO of NITI Aayog that less than 5% of Indians are projected to be below the poverty line, with extreme destitution nearly eradicated, based on the Household Consumption Expenditure Survey (HCES), 2022-23.
- It computes poverty rates by considering income levels, with the poverty threshold established at USD 2.15 per day.
- Other Global Targets:
- SDG target 1.1 aims for global poverty eradication by 2030, setting the ambitious goal for all countries, regions, and groups to reach zero poverty at the same international poverty line.
- Niti Aayog Recent Paper On Poverty:
- A recent NITI Aayog discussion paper revealed a significant reduction in multidimensional poverty in India, dropping from 29.17% in 2013-14 to 11.28% in 2022-23, leading to 24.82 crore individuals escaping multidimensional poverty over the 9-year period.
- The paper analysed multidimensional poverty trends in India from 2005-06 to 2022-23, using National Family Health Survey (NFHS) data and projection methods for years without NFHS data.
Read More: Household Consumption Expenditure Survey 2022-23
UPSC Civil Services Examination, Previous Year Question:
Prelims
Q. In a given year in India, official poverty lines are higher in some States than in others because (2019)
(a) poverty rates vary from State to State
(b) price levels vary from State to State
(c) Gross State Product varies from State to State
(d) quality of public distribution varies from State to State
Ans: (b)
Q. With reference to the provisions made under the National Food Security Act, 2013, consider the following statements: (2018)
- The families coming under the category of ‘below poverty line (BPL)’ only are eligible to receive subsidised food grains.
- The eldest woman in a household, of age 18 years or above, shall be the head of the household for the purpose of issuance of a ration card.
- Pregnant women and lactating mothers are entitled to a ‘take-home ration’ of 1600 calories per day during pregnancy and for six months thereafter.
Which of the statements given above is/are correct?
(a) 1 and 2 only
(b) 2 only
(c) 1 and 3 only
(d) 3 only
Ans: (b)
Mains:
Q.1 COVID-19 pandemic accelerated class inequalities and poverty in India. Comment. (2020)
Q.2 ‘Despite implementation of various programmes for eradication of poverty by the government in India, poverty is still existing’. Explain by giving reasons. (2018)


