Social Issues
Women and Men in India 2023
- 14 Aug 2024
- 13 min read
For Prelims: Women and Men in India 2023, Sex Ratio, Age Specific Fertility Rate (ASFR), Maternal Mortality Ratio (MMR), Infant Mortality Rate (IMR), Under Five Mortality Rate, Labour Force Participation Rate (LFPR), Child Care Subsidies, Pre conception and Pre Natal Diagnostic technique Act,1994
For Mains: Age Demography, Son Meta Preference, Changing Pattern of Indian Demography and its Socieo-economic Implications.
Why in News?
The Ministry of Statistics and Programme Implementation has released the 25th edition of report titled Women and Men in India 2023.
- It offers a comprehensive overview of gender dynamics in India, covering data on population, education, health, economic participation, and decision-making involvement.
- It presents data disaggregated by gender, urban-rural divide, and geographical region to understand existing disparities in society.
What are Key Highlights of the 2023 Report?
- Population: By 2036, the population of India is expected to reach 152.2 Crores.
- Improvement in sex ratio: Sex ratio in India is expected to improve to 952 women per 1000 men by 2036 from 943 in 2011.
- Female percentage is expected to constitute 48.8% in 2036 compared to 48.5% in 2011. India's population in 2036 is expected to be more feminine.
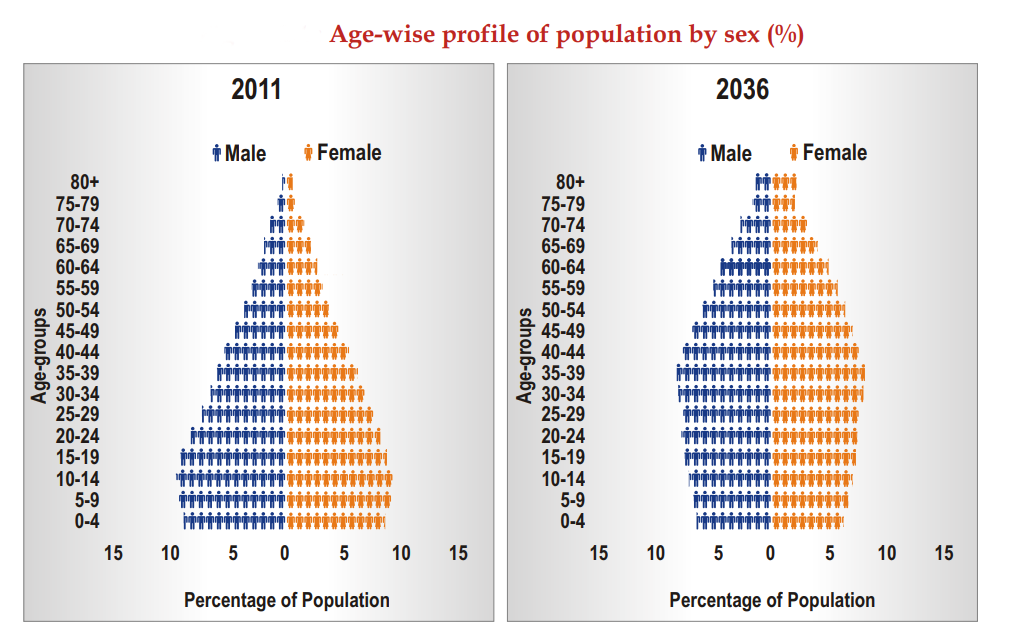
- Age Demography: The proportion of individuals under 15 years is projected to decrease from 2011 to 2036, likely due to declining fertility.
- The proportion of the population aged 60 years and above is anticipated to substantially increase.
- Age Specific Fertility Rate (ASFR): From 2016 to 2020, ASFR in the age group of 20-24 and 25-29 has reduced from 135.4 and 166.0 to 113.6 and 139.6 respectively.
- ASFR is defined as the number of live births in a specific age group of women per thousand female populations of that age group.
- The ASFR for the ages 35-39 for the above period has increased from 32.7 to 35.6 which shows that after settling in life, women are thinking of expanding their family.
- Adolescent Fertility Rate was 33.9 for the illiterate population whereas 11.0 for the literate in 2020.
- ASFR is defined as the number of live births in a specific age group of women per thousand female populations of that age group.
- Maternal Mortality Ratio (MMR): India has successfully achieved the major milestone of bringing down its MMR (97 per lakh live births in 2018-20). (SDG target - Reduce MMR to 70 by 2030).
- MMR is defined as the number of maternal deaths during a given time period per 100,000 live births during a year.
- Infant Mortality Rate (IMR): Both Male IMR and Female IMR were equal at the level of 28 infants per 1000 live births in 2020.
- IMR is the probability of a child born in a specific year or period dying before reaching the age of one year.
- Under Five Mortality Rate: It has decreased from 43 in 2015 to 32 in 2020. The under five mortality rate gap between boys and girls has also reduced.
- Labour Force Participation Rate (LFPR): Male LFPR has gone from 75.8 to 78.5 during 2017-18 to 2022-23 and female LFPR has gone from 23.3 to 37 during the same period.
- LFPR is defined as the section of the working population in the age group of 16-64 in the economy currently employed or seeking employment.
- Participation in Election: The 2014 Lok Sabha elections marked a significant change, with women's participation increasing to 65.6%, and further rising to 67.2% in the 2019 Lok Sabha elections.
- Women Entrepreneurship: The Department for Promotion of Industry and Internal Trade (DPIIT) has recognized a total of 1,17,254 start-ups between 2016 and 2023.
- Among these, 55,816 start-ups are led by women, constituting 47.6% of the total recognized start-ups.
Note:
- Currently, Indian age pyramids exhibit a triangular shape. As per data of MoSPI, by 2036, pyramid projected to transition to a bell shape, tapering towards the top.
- A population pyramid is a graphical representation of the distribution of people by sex and age group.
- Triangular Shaped Pyramids: They have a wide base and are typical of less developed countries. These have larger populations in lower age groups due to high birth rates. E.g., Bangladesh, Nigeria etc.
- Bell Shaped Tapered Towards the Top: It shows birth and death rates are almost equal leading to a near constant population. E.g., Australia.
What is Demographic Transition Model?
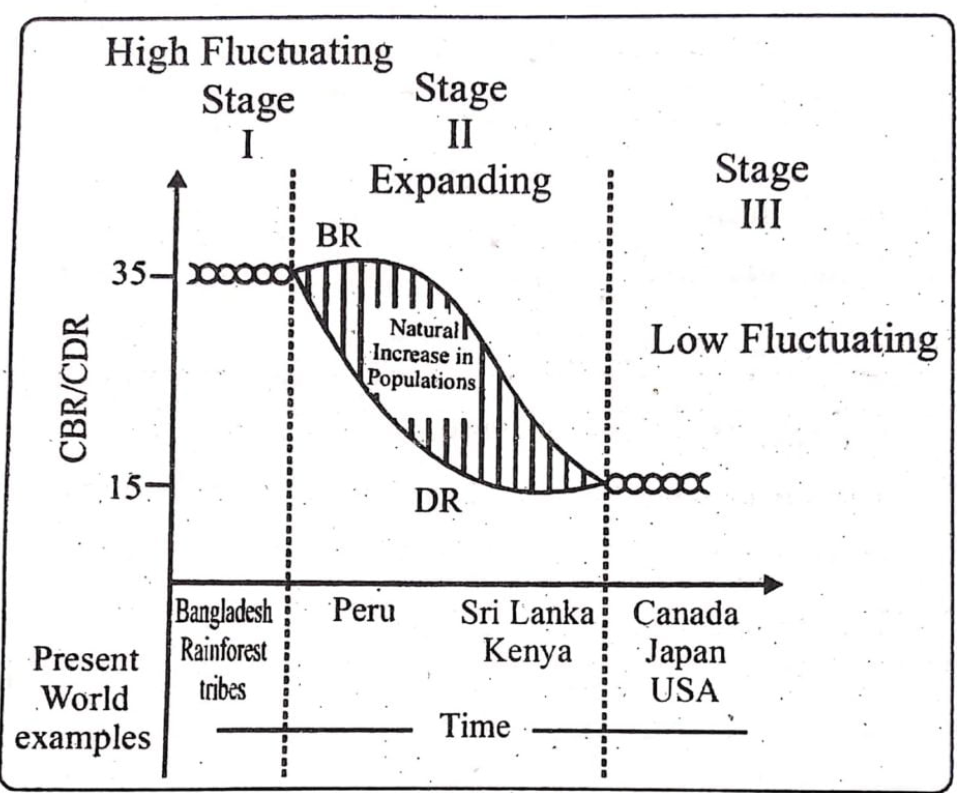
- The Demographic Transition Model (Population Cycle) shows changes in population growth rates and the effect on population.
- It was developed by the American demographer Warren Thompson in 1929.
- This can be divided into four stages:
- Stage 1: The first stage has high fertility and high mortality because people reproduce more to compensate for the deaths due to epidemics and variable food supply.
- The population growth is slow and most of the people are engaged in agriculture where large families are an asset.
- Life expectancy is low, people are mostly illiterate and have low levels of technology.
- Two hundred years ago all the countries of the world were in this stage.
- Stage 2: Fertility remains high in the beginning of the second stage but it declines with time. This is accompanied by a reduced mortality rate.
- Improvements in sanitation and health conditions lead to decline in mortality. Because of this gap the net addition to population is high.
- Stage 3 : Both fertility and mortality decline considerably. The population is either stable or grows slowly.
- The population becomes urbanised, literate and has high technical knowhow and deliberately controls the family size.
- This shows that human beings are extremely flexible and are able to adjust their fertility.
- Stage 1: The first stage has high fertility and high mortality because people reproduce more to compensate for the deaths due to epidemics and variable food supply.
What are the Challenges Associated with India’s Demographic Profile?
- Son Meta Preference: India has been facing a skewed sex ratio at birth for many years, which has been a cause for concern.
- Sons are expected to continue the family name and support parents financially, while daughters are viewed as a liability due to dowry costs and leaving the family after marriage.
- Aging Population: While India has the highest number of young people, aging is rapidly progressing. The current elderly population of 153 million (aged 60 and above) is expected to reach a staggering 347 million by 2050.
- Disparity in Health Outcomes: In the northeastern states, Assam has the highest infant mortality rate, followed by Meghalaya and Arunachal Pradesh.
- There is still a wide disparity in health outcomes for children between rural and urban India.
- Barrier to Women's LFPR: Deep rooted patriarchal norms and traditional gender roles often limit women's access to education and employment opportunities.
-
Societal expectations may prioritise women's roles as caregivers and homemakers, discouraging their active participation in the labor force.
-
- Absence of Informed Choice in Elections: Lack of education among the masses to make informed choices while voting. Voters also get swayed on the basis of their caste and religious identity.
- Informal Women Entrepreneurship: Women led enterprises are primarily rural, small-scale, and informal. They operate mostly from home-based setups which includes textiles, garments, handicrafts, food processing etc.
- They lack formal funding and social security benefits.
What are Initiatives Related to Overall Demographic Development in India?
Way Forward
- Balanced Sex Ratio: Periodical meetings with proprietors of scan centres need to be organised for enforcement of Pre conception and Pre Natal Diagnostic technique Act,1994. Ensure legal action on quacks who indulge in illegal abortions.
- To prevent unwanted pregnencies the use of contraceptives like Oral pills, injectables and intrauterine devices can be encouraged.
- Handling Aging Population: India needs to provide specialised healthcare for seniors, foster intergenerational bonding to enrich society, and use technology to make healthcare and social services accessible and affordable for the elderly. It will give boost to the silver economy.
- Silver economy includes all those economic activities, products and services designed to meet the needs of people over 50.
- Boosting Women's LFPR: Child-care subsidies free up mothers’ time to enter the labour force and have had significant implications in impacting female employment.
- Supporting Women Entrepreneurship: Formalisation of women enterprises, institutional finance and skilling can ensure greater participation and equity for women entrepreneurs.
|
Drishti Mains Question Q. What are the various challenges associated with Indian demography? How can they be mitigated for sustainable development? Discuss. |
UPSC Civil Services Examination, Previous Year Question (PYQ)
Prelims:
Q. To obtain full benefits of demographic dividend, what should India do? (2013)
(a) Promoting skill development
(b) Introducing more social security schemes
(c) Reducing infant mortality rate
(d) Privatization of higher education
Ans: (a)
Q. India is regarded as a country with “Demographic Dividend”. This is due to (2011)
(a) Its high population in the age group below 15 years
(b) Its high population in the age group of 15-64 years
(c) Its high population in the age group above 65 years
(d) Its high total population
Ans: (b)
Q. Despite being a high saving economy, capital formation may not result in significant increase in output due to (2018)
(a) weak administrative machinery
(b) illiteracy
(c) high population density
(d) high capital-output ratio
Ans: (d)
Q. As per India’s National Population Policy, 2000, by which one of the following years is it our long-term objective to achieve population stabilization? (2008)
(a) 2025
(b) 2035
(c) 2045
(d) 2055
Ans: (c)
Mains:
Q. Examine the role of ‘Gig Economy’ in the process of empowerment of women in India (2021)
Q. Discuss the main objectives of Population Education and point out the measures to achieve them in India in detail.
Q.Critically examine whether growing population is the cause of poverty OR poverty is the main cause of population increase in India. (2015)


