Annual Survey of Industries Report 2022-23 | 03 Oct 2024
For Prelims: Annual Survey of Industries, Gross Value Added, Gross Domestic Product (GDP), Net Value Added, National Statistical Office (NSO)
For Mains: Gross Value Added and its significance in assessing economic growth, Annual Survey of Industries (ASI), Growth & Development
Why in News?
Recently, the Ministry of Statistics and Programme Implementation (MoSPI) released the Annual Survey of Industries (ASI) for 2022-23 which presents significant insights into the recovery and growth of the manufacturing sector in India.
- The survey fieldwork was conducted from November 2023 to June 2024 for ASI 2022-23.
What are the Key Highlights of the ASI Report 2022-23?
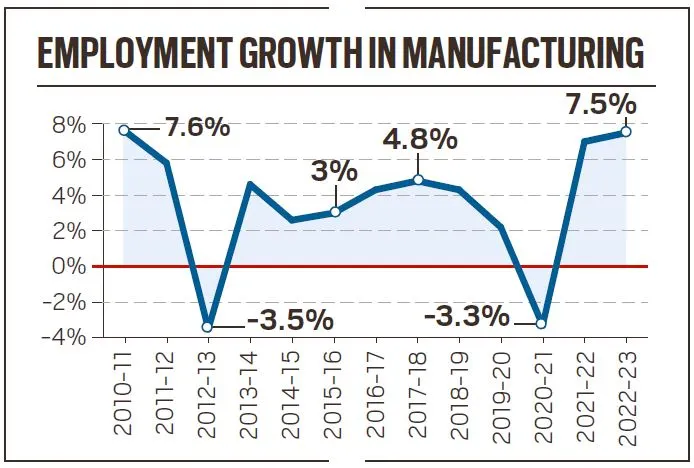
- Employment Growth in Manufacturing:
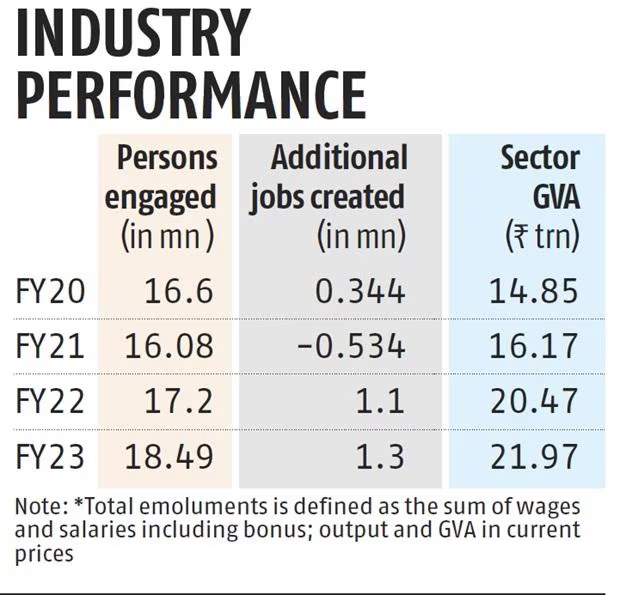
- The ASI indicates that employment in manufacturing grew by 7.5% from 1.72 crore in 2021-22 to 1.84 crore in 2022-23, the highest rate of growth in the last 12 years.
- In 2022-23, the manufacturing sector created 13 lakh jobs, an increase from 11 lakh in FY22.
- Gross Value Added (GVA) and Output Growth:
- The manufacturing GVA grew robustly by 7.3%, reaching Rs 21.97 lakh crore in 2022-23, up from Rs 20.47 lakh crore in 2021-22.
- The total industrial input increased by 24.4%, while the output grew by 21.5% in the sector in 2022-23 compared to 2021-22, reflecting a significant rebound in manufacturing activities.
- Main Drivers of Manufacturing Growth:
- The primary drivers of manufacturing growth in 2022-23 were basic metals, coke and refined petroleum products, food products, chemicals, and motor vehicles.
- Together, these industries accounted for about 58% of total output.
- The primary drivers of manufacturing growth in 2022-23 were basic metals, coke and refined petroleum products, food products, chemicals, and motor vehicles.
- Regional Performance:
- Top 5 states in terms of employment were Tamil Nadu, Maharashtra, Gujarat, Uttar Pradesh, and Karnataka.
- Increase in Number of Factories:
- The number of factories increased from 2.49 lakh in 2021-22 to 2.53 lakh in 2022-23, marking the first full recovery phase after Covid-19 disruptions.
- Informal Sector Decline:
- The informal sector saw a 1.5% decline in employment, dropping by 16.45 lakh to 10.96 crore in 2022-23, indicating a shift towards formal employment in manufacturing as per the Annual Survey of Unincorporated Enterprises (ASUSE) 2022-23 report released in July 2024.
- Average Salaries:
- Average emolument per person rose by 6.3%, reaching Rs 3.46 lakh in 2022-23 compared to 2021-22.
- Capital Investment Surge:
- Gross fixed capital formation (GFCF) surged by over 77% to Rs 5.85 lakh crore in 2022-23, while net fixed capital formation saw 781.6% rise to Rs 2.68 lakh crore, supporting sustained manufacturing growth.
- Gross fixed capital formation (GFCF), or "investment," refers to the acquisition of produced assets, including second-hand purchases, as well as the production of assets by producers for their own use, minus disposals.
- Net fixed capital formation is the amount of Gross fixed capital formation (GFCF) minus the amount of consumption of fixed capital.
- Profits in the manufacturing sector increased by 2.7% to Rs 9.76 lakh crore.
- Gross fixed capital formation (GFCF) surged by over 77% to Rs 5.85 lakh crore in 2022-23, while net fixed capital formation saw 781.6% rise to Rs 2.68 lakh crore, supporting sustained manufacturing growth.
Note
- Workers encompass all individuals employed directly or through an agency, including paid and unpaid workers involved in manufacturing processes or cleaning machinery and premises.
- Employees include all workers receiving wages, as well as those in clerical, supervisory, or managerial roles, and those involved in purchasing raw materials or fixed assets, along with watch and ward staff.
Gross Value Added (GVA)
- GVA represents the value that producers add to goods and services throughout the production process.
- It's calculated by subtracting the cost of inputs (intermediate consumption) from total output.
- It's a key component of Gross Domestic Product (GDP), reflecting economic growth. GVA growth rates provide insights into sectoral performance, aiding economic analysis and policymaking.
- GVA = GDP + subsidies on products - taxes on products.
- Net Value Added (NVA) is obtained by deducting depreciation from Gross Value Added (GVA).
- It represents the value of output after subtracting both intermediate consumption and the consumption of fixed capital.
What is the Annual Survey of Industries (ASI)?
- About:
- The Annual Survey of Industries (ASI) is the primary source of industrial statistics in India.
- It began in 1960, using 1959 as the base year, and has been conducted annually since then, with the exception of 1972, in accordance with the Collection of Statistics Act of 1953.
- Since ASI 2010-11, the survey has been conducted under the Collection of Statistics Act, 2008, which was amended in 2017 to extend its coverage to All India.
- Implementing Agency:
- The National Statistical Office (NSO), a part of the Ministry of Statistics and Programme Implementation (MoSPI), conducts the ASI.
- The MoSPI is responsible for ensuring the coverage and quality of the released statistics.
- The National Statistical Office (NSO), a part of the Ministry of Statistics and Programme Implementation (MoSPI), conducts the ASI.
- Scope and Coverage of ASI:
- The ASI extends to the entire country. It covers all factories registered under Sections 2(m)(i) and 2(m)(ii) of the Factories Act, 1948.
- Bidi and cigar manufacturing establishments, registered under the Beedi and Cigar Workers (Conditions of Employment) Act, 1966.
- Electricity undertakings engaged in the generation, transmission, and distribution of electricity, are not registered with the Central Electricity Authority (CEA).
- Units with 100 or more employees registered in the Business Register of Establishments (BRE) maintained by State Governments, as shared by the respective states.
- Data Collection Mechanism:
- Data for the ASI are collected from selected factories in accordance with the Collection of Statistics Act, 2008, as amended in 2017, and the rules established under it in 2011.
What are the Opportunities and Challenges to the Manufacturing Sector in India?
- Opportunities:
- Broad Domestic Market and Demand: The Indian manufacturing sector has witnessed robust demand for its products from both domestic and international clients.
- The Purchasing Managers' Index (PMI) recorded at 58.8 in May 2024 indicates expansion within India's manufacturing landscape.
- Sectoral Advantage: Key manufacturing sectors, including chemicals, pharmaceuticals, automotive, electronics, industrial machinery, and textiles, have shown significant growth in recent years.
- Pharmaceutical manufacturing costs in India are approximately 30%–35% lower than those in the US and Europe.
- Outreach to the Global South Market: Indian manufacturing is shifting from European to Asian Global Value Chains (GVC), with foreign value-added (FVA) from Global Southern partners increasing from 27% to 45% in 2005-2015.
- This offers Indian firms a chance to establish their own GVCs and position India as a regional growth hub.
- Rise of MSMEs: Micro, Small, and Medium Enterprises (MSMEs) contribute around 30% to India’s GDP and play a vital role in driving economic growth, accounting for nearly 45% of the country’s total exports.
- As of March 2024, over 4 crores MSMEs were registered on the Udyam portal, with 67% identified as manufacturing MSMEs.
- Potential for Growth: The Indian manufacturing sector has the potential to reach USD 1 trillion by 2025 highlighting its critical role in the economy.
- Broad Domestic Market and Demand: The Indian manufacturing sector has witnessed robust demand for its products from both domestic and international clients.
- Challenges:
- Outdated Technology and Infrastructure: Reliance on outdated technology and insufficient infrastructure hampers Indian manufacturers' ability to compete globally and meet international quality standards.
- Shortage of Skilled Workforce: According to the World Bank, only 24% of India's workforce possesses the skills needed for complex manufacturing jobs, compared to 52% in the US and 96% in South Korea.
- High Input Costs: The Reserve Bank of India (2022) reported that logistics costs in India are 14% higher than the global average, affecting the overall competitiveness of the manufacturing sector.
- Also the land acquisition process is complex in India.
- Competition from China and Import Dependence: In 2023-24, China accounted for nearly 42% of India's textiles and clothing imports, 40% of machinery, and 38.4% of electronics imports.
What are the Government Initiatives in the Manufacturing Sector in India?
- Production-Linked Incentive (PLI)
- PM Gati Shakti- National Master Plan
- Bharatmala and Sagarmala Project
- Start-up India
- Make in India 2.0
- Atmanirbhar Bharat Campaign
- Special Economic Zones
- Liberalised foreign direct investment (FDI)
- MSME Innovative Scheme
- Ease of Doing Business
- Goods and Services Tax (GST) and Reduction in Corporate tax
Way Forward
- Investment in Infrastructure: Enhancing infrastructure quality and accessibility while reducing logistics costs can attract more investment in manufacturing.
- Need for Industry 4.0: Industry 4.0 adoption can help the manufacturing sector contribute 25% to GDP by FY26. Indian manufacturers are investing 35% of their operating budgets in digital transformation, and this amount should be increased.
- Promoting Export-Oriented Manufacturing: Supporting the development of export-oriented manufacturing can help Indian businesses enter new markets and improve competitiveness through targeted policies.
- Financial Assistance: Many MSMEs face challenges in securing credit for exports, making enhanced financial support for SMEs crucial for their growth.
- Enabling Regulations: Streamlining regulations can reduce burdens on businesses and promote investment in manufacturing.
- Skill Development: Increasing training programs can address the skilled labour shortage and enhance the sector’s competitiveness, as demonstrated by Vietnam’s success in becoming a global manufacturing hub.
|
Drishti Mains Question: Discuss the key opportunities and challenges facing the manufacturing sector in India and suggest measures to enhance its competitiveness in the global market. |
UPSC Civil Services Examination, Previous Year Questions (PYQs)
Prelims
Q1. In the ‘Index of Eight Core Industries’, which one of the following is given the highest weight? (2015)
(a) Coal production
(b) Electricity generation
(c) Fertiliser production
(d) Steel production
Ans: (b)
Q2. With reference to Indian economy, consider the following statements: (2015)
- The rate of growth of Real Gross Domestic Product has steadily increased in the last decade.
- The Gross Domestic Product at market prices (in rupees) has steadily increased in the last decade.
Which of the statements given above is/are correct?
(a) 1 only
(b) 2 only
(c) Both 1 and 2
(d) Neither 1 nor 2
Ans: (b)
Mains
Q.1 “Industrial growth rate has lagged behind in the overall growth of Gross-Domestic-Product(GDP) in the post-reform period” Give reasons. How far are the recent changes in Industrial Policy capable of increasing the industrial growth rate? (2017)
Q.2 Normally countries shift from agriculture to industry and then later to services, but India shifted directly from agriculture to services. What are the reasons for the huge growth of services vis-a-vis the industry in the country? Can India become a developed country without a strong industrial base? (2014)