Biodiversity & Environment
Air Quality Life Index (AQLI) 2024
- 30 Aug 2024
- 12 min read
For Prelims: Air Quality Life Index (AQLI) 2024, PM2.5, World Health Organization (WHO), Malnutrition, Middle East and North Africa (MENA), Water and Sanitation, National Air Quality Standards, Pollution.
For Mains: Impact of Air Pollution on Health and Life Expectancy.
Why in News?
Recently, the Energy Policy Institute at the University of Chicago (EPIC) released the Air Quality Life Index (AQLI) 2024.
- In India, where the annual PM2.5 standard is 40 µg/m³, more than 40% of the population breathes air that exceeds the standard.
What are the Key Findings of the Air Quality Life Index (AQLI) 2024?
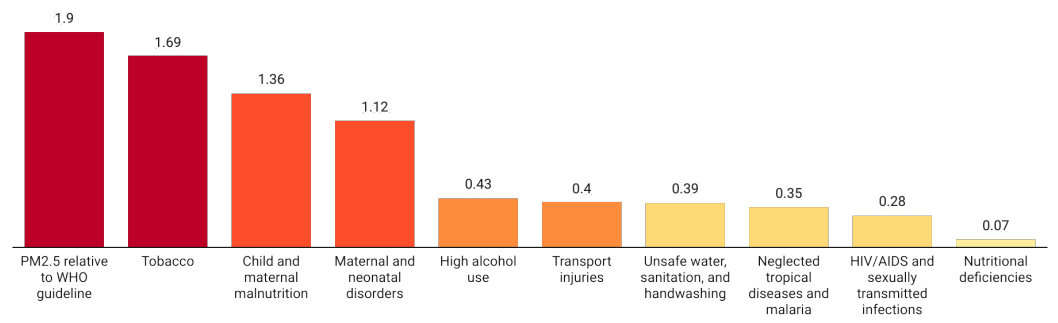
- Impact of Air Pollution on Life Expectancy: The report revealed that if PM2.5 (particulate matter that are 2.5 micrometres or less in diameter) pollution were reduced to meet the guidelines set by the World Health Organization (WHO), the average person could live 1.9 years longer, adding a total of 14.9 billion life years globally.
- The WHO guidelines state that annual average concentrations of PM2.5 should not exceed 5 micrograms per cubic meter (µg/m3).
- Deadlier than Chronic Diseases: The effects of air pollution surpass those of smoking, heavy drinking and are several times greater than other major health risks like HIV/AIDS and malnutrition.
- Uneven Distribution of Pollution: The burden of pollution is not evenly distributed.
- People in the most polluted areas breathe six times more polluted air than those in the cleanest regions, reducing their life expectancy by an average of 2.7 years.
- Non-Compliance: While many countries have established national air quality standards, the report finds that enforcement and compliance remain significant challenges.
- According to the report, 94 countries have established PM 2.5 standards, of which 37 fail to meet their own guidelines. Additionally, 158 countries have not set any standards at all.
- Potential Benefits: The potential benefits of meeting WHO pollution standards are substantial.
- If all countries achieved their goals, the average person in these regions would gain 1.2 years of life expectancy.
- Global Scenario:
- US, China, Europe: The United States, Europe, and China have implemented stringent policies, leading to significant reductions in pollution levels.
- In China, air pollution has decreased by 41% since 2014 and extended the life of Chinese by 2 years.
- The US has reduced pollution by 67.2% since 1970, extending the average lifespan by 1.5 years.
- Europe has seen a 30.2% reduction since 1998, adding 5.6 months to life expectancy.
- South and Southeast Asia: South and Southeast Asia saw notable improvements in 2022, observing a 4% decline in PM2.5 levels compared to 2012.
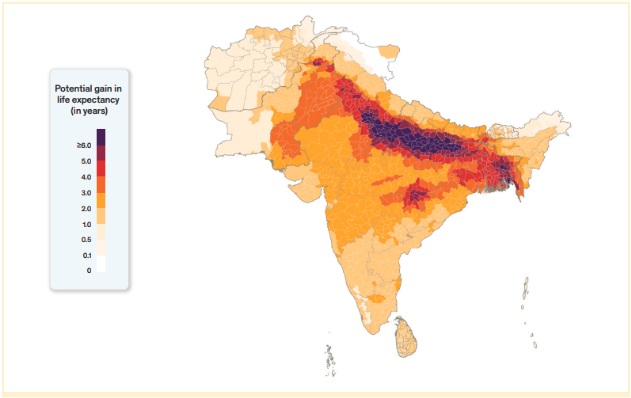
- Despite this improvement, South Asia remains the world’s most polluted region, accounting for 45% of global life years lost due to high pollution.
- Bangladesh, India, Nepal, and Pakistan are among the most polluted countries globally.
- In Myanmar, air pollution is reducing life expectancy by 2.9 years.
- Africa: Air pollution in Central and West Africa has remained largely unchanged in 2022.
- The region’s average PM2.5 concentration is 22.2 micrograms per cubic meter (μg/m3), 4.4 times higher than the WHO guideline.
- This pollution level is reducing life expectancy by an average of 1.7 years across the region.
- However, Nigeria, Rwanda and Ghana have recently implemented air quality regulations and standards.
- West Asia: Middle East and North Africa (MENA) region has emerged as a new pollution hotspot, reducing life expectancy by an average of 1.3 years across the region.
- Qatar and Iraq are the most polluted countries in the region.
- Latin America: Latin America's PM2.5 levels increased by 4.8% from 2021 and 3% from 1998.
- Bolivia is the most polluted country in Latin America; air pollution in Guatemala reduces life expectancy by 2.1 years.
- Cities like Bogotá, Mexico City, and Quito implement driving restrictions and improve public transport to combat pollution.
- US, China, Europe: The United States, Europe, and China have implemented stringent policies, leading to significant reductions in pollution levels.
What are India Specific Findings in Air Quality Life Index (AQLI) 2024?
- Impact of Cleaner Air on Life Expectancy in Delhi: Cleaner air that meets WHO guidelines of 5 µg/m³ can increase the life expectancy of Delhi's 18.7 million residents by 7.8 years.
- Achieving India's national air quality standard (40 µg/m³) could increase life expectancy by 4.3 years.
- Current Air Quality and Trends in Delhi: Delhi is the most polluted city in India, with an average PM2.5 level of 84.3 µg/m³ in 2022.
- However, with an average annual PM2.5 concentration of 84.3 µg/m3 in 2022, Delhi has seen significant improvement.
- Improvement in Air Quality Across India: India saw a decrease in particulate pollution from an average of 49 µg/m³ over the last decade to 41.4 µg/m³ in 2022.
- If this reduction continues, the average Indian could live 9 months longer than if exposed to the previous decade's pollution levels.
- Comparison with Other Health Risks: While particulate pollution takes 3.6 years off the life of an Indian resident, malnutrition takes off 1.6 years, tobacco 1.5 years, and unsafe water and sanitation 8.4 months.
What is the Air Quality Life Index (AQLI)?
- The AQLI is a pollution index that translates the effect of particulate air pollution into its impact on life expectancy.
- The Index then combines the relationship between long-term human exposure to air pollution and life expectancy to provide the true cost of particulate pollution in communities around the world.
- The Index also illustrates how air pollution policies can increase life expectancy when they meet the WHO’s guideline for what is considered a safe level of exposure, existing national air quality standards, or user-defined air quality levels.
How Can We Control Air Pollution?
- Prevention: Adopt pollution prevention approaches to reduce, eliminate, or prevent pollution at its source.
- Examples are to use less toxic raw materials or fuels, use a less-polluting industrial process, and to improve the efficiency of the process. E.g., BSVI engine.
- Adoption of Clean Air Technology: Air pollution prevention and control technologies can help in controlling air pollution.
- It includes wet scrubbers, fabric filters (baghouses), electrostatic precipitators, condensers, absorbers, adsorbers, and biological degradation.
- Economic Incentives: Economic incentives such as emissions trading and emissions caps can be used for polluting industries.
- Scrapping Old Vehicles: Scrapping of the current End-of-life vehicles (ELVs) burden of the country will lead to 15-20% reduction in emissions due to vehicular pollution.
- Work-from-Home: To combat air pollution, the government may promote work-from-home policies during high pollution days like winters.
- Artificial Rain: It can wash away pollutants that are suspended in the air, such as particulate matter (PM), nitrogen oxides (NOx), and sulphur dioxide (SO2).
- Behavioural Change: Promoting the use of public transportation, walking, and cycling can reduce the number of individual vehicles on the road, leading to lower emissions and lower air pollution.
What are the Government Initiatives Taken for Controlling Air Pollution?
Conclusion
Air pollution poses a major threat to India, reducing life expectancy more than other risks like malnutrition or tobacco use. Despite recent improvements, sustained progress demands stronger policies, enforcement, and commitment to cleaner air. Meeting WHO guidelines could significantly enhance life expectancy and overall public health nationwide.
|
Drishti Mains Question: Q. Air pollution is a significant public health challenge in India, impacting life expectancy and quality of life. Suggest additional strategies to achieve sustainable air quality improvement. |
UPSC Civil Services Examination, Previous Year Question (PYQ)
Prelims
Q.In the context of proposals to the use of hydrogen enriched CNG (H-CNG) as fuel for buses in public transport, consider the following statements: (2019)
- The main advantage of the use of H-CNG is the elimination of carbon monoxide emissions.
- H-CNG as fuel reduces carbon dioxide and hydrocarbon emissions.
- Hydrogen up to one-fifth by volume can be blended with CNG as fuel for buses.
- H-CNG makes the fuel less expensive than CNG.Which of the statements given above is/are correct?
(a) 1 only
(b) 2 and 3 only
(c) 4 only
(d) 1, 2, 3 and 4
Ans: (b)
Q.Consider the following: (2019)
- Carbon monoxide
- Methane
- Ozone
- Sulphur dioxide
Which of the above are released into the atmosphere due to the burning of crop/biomass residue?
(a) 1 and 2 only
(b) 2, 3 and 4 only
(c) 1 and 4 only
(d) 1, 2, 3 and 4
Ans: (d)
Q How is the National Green Tribunal (NGT) different from the Central Pollution Control Board (CPCB)? (2018)
- The NGT has been established by an Act whereas the CPCB has been created by an executive order of the Government.
- The NGT provides environmental justice and helps reduce the burden of litigation in the higher courts whereas the CPCB promotes cleanliness of streams and wells, and aims to improve the quality of air in the country.
Which of the statements given above is/are correct?
(a) 1 only
(b) 2 only
(c) Both 1 and 2
(d) Neither 1 nor 2
Ans (b)


